
Article body
Full article
BI Needs DevOps Too: Hengshi Automated Operations and Intelligent Monitoring System
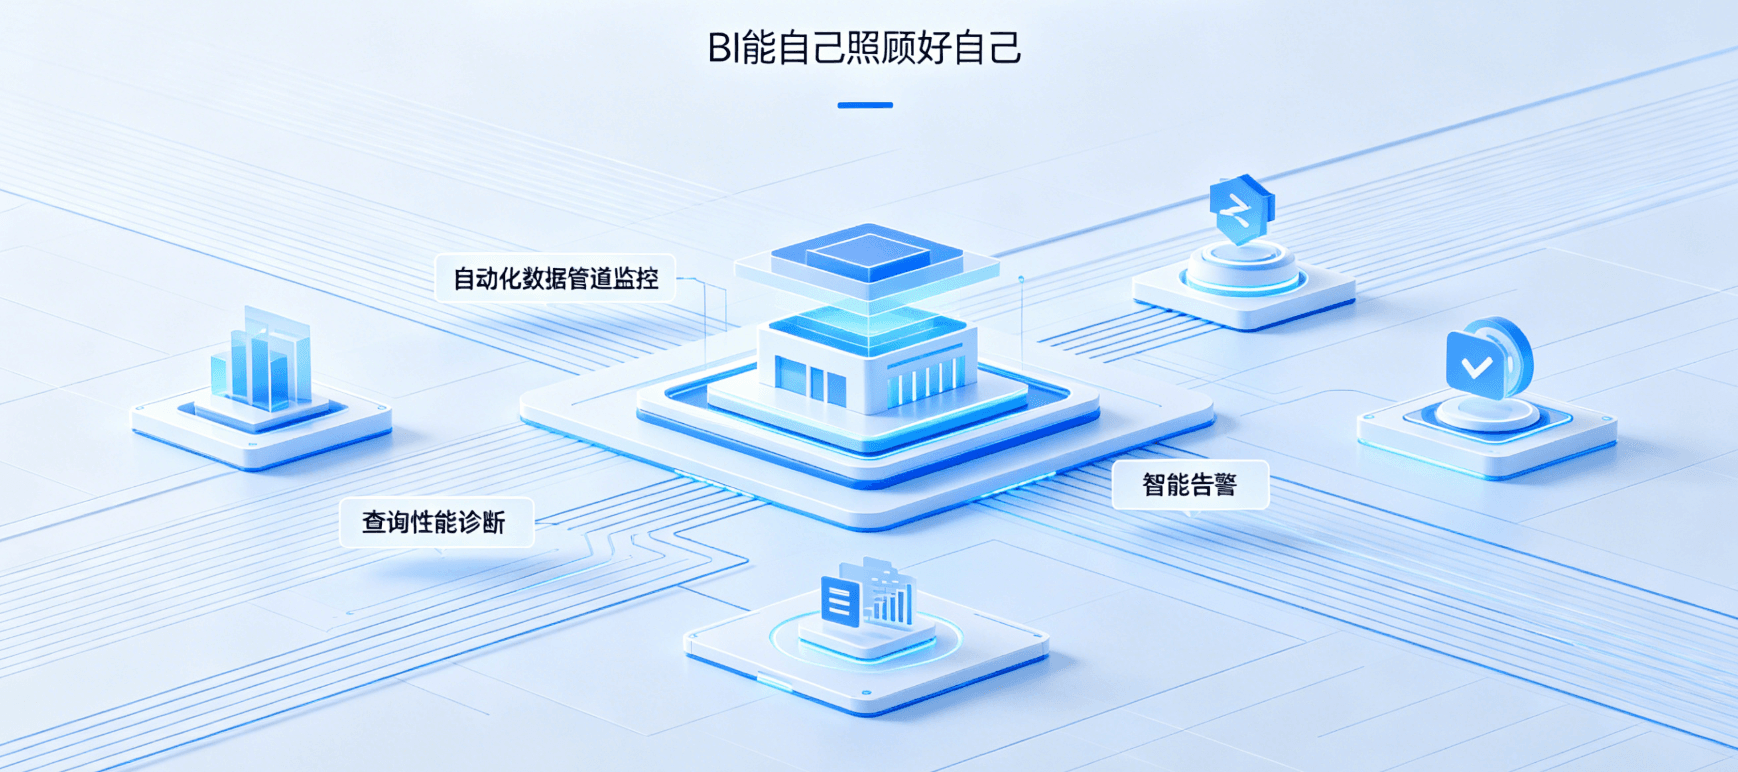
Abstract: BI platform launch is only the first step—the real challenges come after. Who is the first to know when a data source connection breaks? Who saves the day when an ETL job fails at 3 AM? Is a slow-loading dashboard caused by data issues or query engine problems? Hengshis data and system operations system builds a set of BI infrastructure that can take care of itself—from automated data pipeline monitoring and query performance diagnosis to intelligent alerting and self-healing. This article breaks down the design philosophy and key mechanisms of this system.
1. Why BI Operations Is Harder Than Regular System Operations
Regular IT system operations focus on whether servers are running, CPU and memory metrics are normal, and API response times are within thresholds. These metrics have mature open-source solutions like Prometheus combined with Grafana that solve them well.
BI system operations require several additional unique dimensions. First, data-level availability is not just about servers being online—data source connection failures, ETL job failures, and data delays exceeding business tolerance windows are hard for traditional monitoring tools to directly cover. Second, definition consistency—the same metric showing different numbers on two dashboards is not a system failure but a logic deviation, completely invisible to traditional monitoring. Third, multi-variable query performance correlation—dashboard slow loading might be caused by slow SQL, large data volumes, concurrent query resource contention, or just one user dragging too many filter conditions—the troubleshooting chain is far more complex than a simple API timeout. Finally, the user behavior dimension—when dashboard open rates continuously decline, it is not because the system is broken, but because business users find it unhelpful—this cognitive decay also needs monitoring and alerting.
Hengshis approach: decompose BI operations into four independent dimensions—data pipeline operations, system resource operations, query performance operations, and user behavior operations—establishing dedicated monitoring metrics, alerting strategies, and automated response mechanisms for each.
2. Data Pipeline Operations: Do Not Wait for Users to Tell You the Data Is Wrong
2.1 Full-Chain Monitoring
Data travels through a considerable chain from source systems to BI dashboards: data sources (ERP, databases, or Kafka), data ingestion layer (ETL tasks or real-time consumption), datasets (cleansed and aggregated intermediate layers), metric calculation (executing calculations per defined definitions), and dashboard rendering. Any link in this chain failing means end users might see stale or incorrect data.
Hengshi sets monitoring points at each step of this chain. At the data source layer: connection status, latency, and change frequency. At the ingestion layer: ETL task execution status, duration, and rows processed, compared against historical baselines. At the dataset layer: data refresh time deviation from expected refresh time. At the metric calculation layer: computation duration, result row counts, and anomalies compared against previous cycle results. At the dashboard rendering layer: whether data delivered to users is accurate and timely.
2.2 Intelligent Baseline Alerting
Traditional fixed-threshold alerting has high false-positive rates in scenarios with fluctuating data volumes. For example, an e-commerce system naturally has more orders on weekdays than weekends—alerting on fixed order volume anomalies would trigger every weekend.
Hengshi uses dynamic baseline alerting—automatically establishing each metrics normal fluctuation range for each time period based on historical data, only triggering alerts when actual values significantly deviate from historical同期 baselines. A 60% drop in weekend orders compared to weekdays is normal, but a 30% further drop on a particular Saturday compared to past Saturdays is worth noting.
2.3 Automated Task Orchestration
ETL tasks in data pipelines often have complex dependencies—Task B depends on Task A output, and Task C depends on Task B. When Task A fails, B and C are meaningless even if they execute.
Hengshi has a built-in task dependency orchestration engine: any link in the dependency chain fails, all downstream tasks automatically skip, avoiding generating analysis results based on incorrect data. Task failures trigger preset retry strategies with attempts and results recorded. If a task fails a set number of consecutive times, alert severity automatically escalates and notifies the data engineer. Retry strategies also support differentiated configuration—simple data pull tasks can retry twice immediately, while complex data cleansing tasks can be configured flexibly based on business conditions.
3. System Resource Operations: More Than CPU and Memory
Traditional server monitoring focuses on CPU usage, memory usage, disk I/O, and network bandwidth—these are just basic metrics for BI systems and insufficient for locating actual performance bottlenecks.
Hengshi adds BI-specific resource monitoring dimensions on top of these. Query concurrency reflects the pressure on the query engine when multiple dashboards load simultaneously. Query queue depth reflects query backlog—when the queue grows, the engine cannot keep up with request speed. Data cache hit rate directly reflects computing efficiency. Dashboard load time is the metric users actually experience—Hengshi tracks P50, P95, and P99 dashboard load times per load, evaluating overall health from actual user experience perspective, triggering diagnostic analysis once P95 dashboard load time shows continuous deterioration.
4. Query Performance Operations: Finding the Root Cause of Slow Queries
4.1 Automatic Slow Query Capture and Classification
Hengshi automatically captures queries exceeding the execution time threshold and classifies them. Queries with excessive scanned rows may lack suitable indexes or have overly broad filter conditions—after capture, the system suggests adding indexes or optimizing filters. Queries with excessive joins involve large cross-table associations, possibly from overly flattened dataset design—the system recommends materializing intermediate results or optimizing dataset structure. Duplicate queries that execute identical or highly similar queries multiple times—the system recommends enabling query caching or adjusting result refresh strategies.
4.2 Automatic Query Plan Analysis
For captured slow queries, Hengshi analyzes their query plans, extracting bottleneck operations (such as full table scans, Cartesian product joins, large data sorts) and generating optimization suggestions. These suggestions are pushed to Hengshis Operations Workbench, where data engineers can process them sorted by severity.
4.3 Automatic Cache Strategy Tuning
Caching is critical in BI scenarios but the strategy is complex. Too-short cache time means low hit rates and wasted query resources; too-long cache time means poor data timeliness. Hengshi provides automatic cache tuning: frequency-driven strategy automatically extends cache time for dashboards with high-frequency queries; data correlation strategy automatically invalidates related caches when underlying data sources are updated; timezone intelligence facilitates cross-timezone team access. Additionally, cache efficiency analysis reports provide cache hit rates, invalidation counts, and average survival times for queries.
5. User Behavior Operations: From System Healthy to Business Healthy
BI platform health is reflected not only in technical metrics, but even more in business metrics. A BI platform with all-green technical metrics may be quietly being abandoned by users.
5.1 User Activity Analysis
Hengshi tracks the following behavioral metrics to measure platform business health: weekly active users and weekly active dashboards are core metrics for measuring platform usage breadth; average dashboard dwell time reflects the depth of data value to users; self-service analysis rate—the proportion of users who independently create dashboards or initiate queries among total active users—is a key metric for measuring platform empowerment; ad-hoc query proportion reflects whether users are actively exploring data rather than passively consuming existing dashboards; search-style question proportion reflects whether users rely on ChatBIs dialogue mode for direct questions.
5.2 Dashboard Health
It is not just about inactive users—look for zombie dashboards—dashboards created but never viewed again. If an organizations zombie dashboard proportion exceeds 20%, it indicates resource waste in previous BI construction. Hengshi also tracks query failure counts, average load times, and last access times by dashboard, helping administrators proactively clean up zombie content.
5.3 Dashboard Performance and User Churn
When dashboards load slowly enough, users give up viewing them. Hengshi correlates dashboard access data with performance data and cross-analyses to discover the actual impact of performance bottlenecks on user retention—dashboards with continuously deteriorating P95 load times see synchronized declines in weekly active users, proving performance directly impacts usage rates.
6. Intelligent Alerting and Self-Healing
6.1 Alert Classification and Suppression
Hengshis alerts are divided into three levels: P0 Critical is complete data unavailability or core query engine outage, requiring immediate notification to on-call personnel and designated management groups; P1 Severe is partial data source connection interruption or ETL task consecutive failures or severely deteriorated query performance, pushing to enterprise IM and notifying responsible parties; P2 Warning is single ETL failure but successful retry or minor cache hit rate decline or some dashboard loading slower but not affecting core business.
Alert suppression strategies include: the same alert does not resend within a short period, only accumulating counts; sub-task alerts that do not affect the main flow can be configured to silent; alerts during maintenance windows automatically downgrade to records without pushing.
6.2 Automated Self-Healing
For known-cause faults with clear repair steps, Hengshi supports configuring automated self-healing strategies. When ETL task failure is detected and the failure cause is temporary data source unavailability, the system automatically retries at set intervals and counts—successful retry automatically recovers and the alert downgrades to notification. When query engine load is too high, automatically enables rate limiting and degraded queuing for non-urgent queries. When core data pipeline is abnormal and automatic self-healing fails, automatically triggers backup strategy to notify human intervention. There are also lightweight fixes such as automatically clearing invalid caches, restarting unresponsive Worker processes, and fixing data source connection pool leaks.
7. Operations全景 Dashboard
Hengshis operations workbench consolidates all monitoring dimensions into a unified interface: the top has core metrics panels like overall health score, the middle has real-time task flow and alert lists, and the bottom has performance overview and trend charts.
Different roles see different views. Data engineers focus on data pipeline health and ETL success rates. DBAs focus on query performance and slow query optimization suggestions. Operations engineers focus on system resources and water level trends. BI administrators focus on user activity, dashboard health, self-service analysis rates, and zombie dashboard cleanup reminders. Each roles view data comes from the same source but with different perspectives, ensuring information and decision-making闭环.
8. FAQ
Q1: Does Hengshis operations system require additional deployment?
Operations monitoring is a built-in Hengshi platform capability and does not require additional deployment. Data pipeline monitoring, query performance analysis, and user behavior statistics are all part of the features, automatically collected while you deploy and use the platform. Alert channels (Enterprise WeChat, DingTalk, email) need to be configured once during initial deployment.
Q2: Can it integrate with our existing Prometheus and Grafana?
Yes. Hengshis core operations metrics can be exposed through standard interfaces, consumable by Prometheus with Grafana or other infrastructure monitoring tools, seamlessly integrating with the existing enterprise dashboard system.
Q3: How long does historical baseline accumulation take?
User behavior baselines generally take 2-4 weeks to establish; query performance baselines 1-2 weeks; data pipeline baselines can range from one week to one month depending on task frequency. Hengshi uses more relaxed alerting strategies during baseline accumulation periods, tightening thresholds as baseline confidence increases.
Conclusion
The final form of enterprise BI construction is not the moment the platform goes live, but a long-term state where the platform runs stably and continuously, data remains reliable, and users remain willing to use it. Hengshis automated operations system transforms the BI platform from a fragile system requiring manual monitoring into a robust system with self-diagnosis and self-repair capabilities. This is both a hallmark of enterprise BI maturity and a natural extension of AI capabilities in BI infrastructure.