
Article body
Full article
一、The Data Dilemma of Non-Technical Teams
In most enterprises, non-technical teams face a common data dilemma: they have the most urgent data needs—HR needs quarterly headcount analysis, Finance needs monthly business analysis, Operations needs to evaluate campaign effectiveness—but they can’t obtain data on their own. They don’t know SQL, can’t use BI tools, and don’t know which tables the data lives in. So they have to go to IT for data, and IT’s request queue is backed up two months. By the time the data arrives, its analytical timeliness is gone.
This isn’t anyone’s fault—it’s an inherent contradiction of traditional data division: data demand is on the business side, data capability is on the technical side, and the gap between them is bridged by queuing.
One of Hengshi Data Agent’s design goals is to bridge this gap—enabling non-technical users to bypass the learning curve of SQL and BI tools and directly obtain analysis results through natural language.
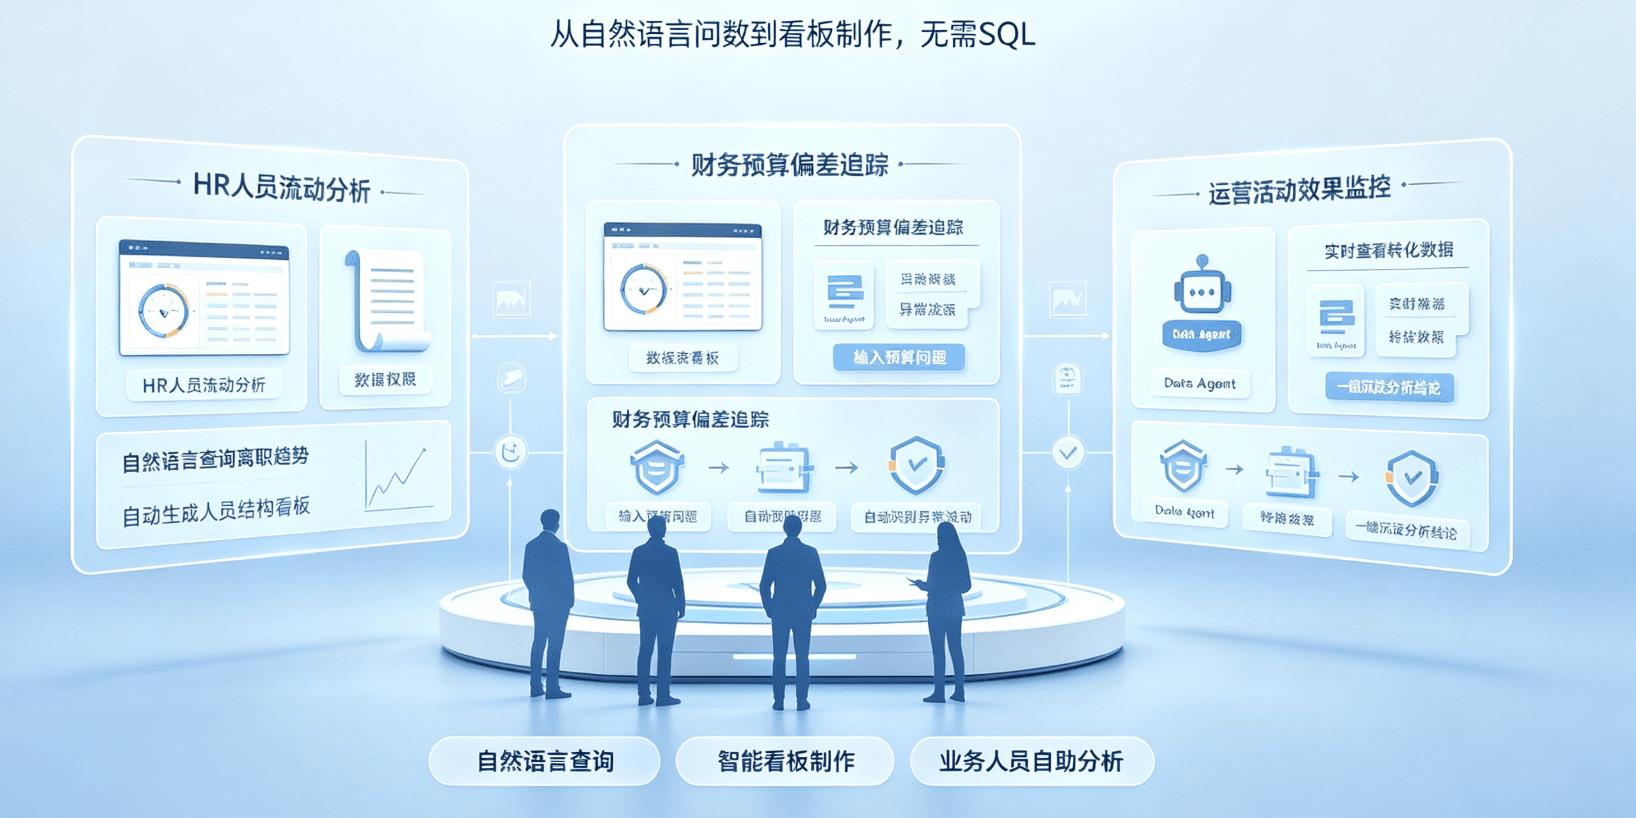
二、HR Team: From “Going by Gut Feel” to “Data-Driven Talent Management”
2.1 Typical Scenario 1: Employee Turnover Analysis
What HR most wants to know: Which departments have the most departures, which roles have the worst retention, and which months see departure peaks.
In Hengshi Data Agent, the HR director only needs to open ChatBI and ask a natural language question: “Show me the monthly employee turnover rate by department for the past 12 months.” This request automatically matches the “turnover rate” metric in the Metrics Platform (formal departures / end-of-period headcount), then automatically breaks down the analysis by organizational structure and time dimensions.
HR doesn’t need to know which HR system tables the data lives in, doesn’t need to write any SQL, and can add the analysis results to the HR dashboard for monthly automatic refresh.
2.2 Typical Scenario 2: Recruitment Efficiency Analysis
“Per-hire cost and post-onboarding retention by recruitment channel” and “time-to-fill and annual target comparison by department”—these types of questions get analysis results directly from ChatBI. HR can further have the Visualization Creation Agent generate charts from results and configure them into the recruitment analysis section of the HR dashboard.
2.3 Self-Service Dashboard Creation
The Visualization Creation Agent enables non-technical users to create dashboards independently. When HR needs a “recruitment channel funnel conversion dashboard,” they simply describe the requirement in ChatBI. The Agent analyzes available dimensions and metrics in the HR data source, automatically recommends suitable chart types—bar charts for channel distribution, funnel charts for stage conversion, line charts for trends—and creates a draggable, adjustable dashboard layout.
三、Finance Team: From “Manual Excel Reconciliation” to “Real-Time Budget Control”
3.1 Typical Scenario 1: Budget Execution Tracking
What haunts Finance most is budget overruns. The traditional approach is to get each department’s expense claims at month-end, manually aggregate and compare with the annual budget—and by the time an overrun is discovered, it’s already too late.
After connecting Data Agent, Finance’s daily budget monitoring becomes: open Hengshi’s dashboard in the morning and see the department budget execution rate automatically refreshed from the previous night. If any department’s budget utilization is abnormal or significantly deviates from historical baseline, ChatBI flags it with a warning.
Finance can also directly ask: “Show budget utilization rate by department for this month compared to the same period last year, flagging departments exceeding 80%“—ChatBI automatically filters qualifying departments and highlights them with emphasis color.
3.2 Typical Scenario 2: Cost Structure Analysis
“Break down manufacturing cost composition changes by category, highlighting cost items with year-over-year growth exceeding 10%“—this complex cost attribution analysis traditionally requires first exporting data tables, writing formulas in Excel, then manually flagging anomalies. In ChatBI, this problem requires only a natural language description to complete the analysis with automatic flagging.
3.3 Regular Report Automation
The dozen or so standard reports Finance needs to produce monthly (expense analysis, profit analysis, capital analysis, etc.)—through JARVIS + ChatBI联动, data extraction, calculation, and formatting complete automatically, and Finance staff only need to do final review and minor adjustments.
四、Operations Team: From “Going by Gut Feel for Campaigns” to “Data-Validated Results”
4.1 Typical Scenario 1: Real-Time Campaign Performance Monitoring
Operations runs a marketing campaign and most wants to know: How much was spent, how many new customers were acquired, and how are the new customers converting.
On Hengshi, the Operations director asks ChatBI “Track ROI and acquisition effectiveness for currently active marketing campaigns.” ChatBI automatically matches relevant metrics, time ranges, and data sources and returns a result summary within seconds. You can then one-click add each metric from the answer to the Operations dashboard and enable real-time refresh to see the latest data every minute during the campaign.
4.2 Typical Scenario 2: User Behavior Analysis
“New user core behavior conversion funnel for day 1, week 1, and month 1 after registration” and “main characteristic profile of users who churned last month”—these types of questions previously required the data team to export user behavior logs and perform complex SQL joins. In ChatBI, Operations can directly ask in natural language and get analysis results.
4.3 Typical Scenario 3: A/B Test Analysis
Operations ran an A/B test and wants to know if the difference in key metrics between the two user groups is significant. Hengshi ChatBI can directly compare all core metrics for the two groups, calculate difference ratios, and provide analysis conclusions based on preset significance criteria.
五、Key Design Principles for Getting Non-Technical Teams “Using It”
5.1 Data Permission Pre-Configuration
The prerequisite for non-technical users to use Data Agent is that data permissions are already configured. The IT team needs to set data access ranges for non-technical roles in advance—HR team can only see HR data, Finance can only see Finance data, Operations directors can only see their own business line data. Row-level permissions ensure regional managers can only see their region’s data and can’t accidentally read other regions’ data.
5.2 Business Terminology Library
Non-technical users speak business language, not technical language. Hengshi supports building a business terminology mapping library—mapping business terms like “turnover rate” and “per-hire cost” to standard metrics in the Metrics Platform. Once the terminology library is built, non-technical users can describe requirements using familiar vocabulary and get accurate results.
5.3 Progressive Guidance
On first use, the system provides guidance templates—directly listing high-frequency questions that non-technical teams might be interested in and turning them into one-click quick question buttons. After a user clicks a button and sees results for the first time, they’ll naturally want to do further analysis and drill down by dimension. The habit of multi-turn questioning develops naturally through this process.
5.4 Quick Feedback Channel
When non-technical users encounter AI misunderstandings or inaccurate answers, they can flag feedback with one click. The data team regularly extracts high-frequency ambiguity issues from these flags to continuously optimize terminology mapping and Agent configuration.
六、FAQ
Q1: Is it safe for non-technical teams to query data using natural language? Could they access data they shouldn’t?
Safe. All Data Agent queries go through dual filtering by the Metrics Platform and permission system—the Agent can only access data that the current user is authorized to view and cannot bypass permissions.
Q2: What if a non-technical user asks a question that’s too vague?
ChatBI will guide users to make necessary clarifications and follow-up questions, such as supplementing time dimensions and analysis definitions, until the question can be precisely executed. This natural language-based interaction is naturally user-friendly for non-technical users.
Q3: Can the dashboard quality created by non-technical teams be guaranteed?
The Visualization Creation Agent automatically recommends chart types and layouts based on data characteristics and best practices. You can also set up a quality control process where dashboards need approval from a data analyst before publishing.
Conclusion
Enabling HR, Finance, and Operations teams to make data-driven daily decisions—this is what true BI “democratization” looks like. Hengshi Data Agent, through natural language interaction, self-service visualization creation, and deep integration with the metrics semantic layer, lowers the barrier to data analysis from “needing to know SQL” to “just needing to be able to speak,” bridging the data gap between business and technical teams.
This article is based on Hengshi Data Agent’s application practices in non-technical teams.