
Article body
Full article
BI Without Mobile Is BI Half Done: Hengshi Multi-Platform Embedding and Integration Guide
Abstract: Over 70 percent of enterprise managers first data contact happens on a mobile phone: a screenshot shared in a WeChat group, a daily report pushed on DingTalk, or a data card seen when opening OA. If BI only lives in PC browser dashboards, it only reaches less than one-third of data consumers. This article breaks down Hengshi BI multi-platform embedding strategy—from mobile H5 adaptation, mini-program integration, and enterprise IM embedding to SDK deep customization—providing a complete engineering guide for making BI everywhere.
1. The Multi-Platform Dilemma: The World Beyond PC
Traditional BI tools were originally designed for PC big screens: 27-inch monitors, mouse drag-and-drop interaction, multiple charts arranged side by side for comparison. But real data consumption scenarios have profoundly changed.
Mobile scenarios have become mainstream. Management wants to see yesterday operational data during commutes, regional managers want to check store real-time performance during shop floor rounds, and salespeople want customer analysis reports before client visits. The common characteristic of these scenarios: only a phone, no mouse, small screen, tight time.
Embedded consumption exceeds standalone access. In many enterprises, data analytics actually does not happen in the BI platform—managers see associated business data in OA approval flows, operations staff receive automatically pushed daily reports in enterprise WeChat groups, and customers see usage analytics in their own backends. Data consumption is embedded in workflows, not in dedicated BI tools.
The challenge of multi-platform consistency. A metric displays as 1 million on a PC dashboard but 998,000 on a mobile dashboard—same definitions but the data differs by two thousand. This inconsistency instantly destroys user trust in data accuracy. Therefore, multi-platform embedding is not simply adding a mobile version, but ensuring consistency from data sources to metric definitions to rendering logic.
2. Hengshis Multi-Platform Architecture: One Platform, Multiple Presentations
2.1 Responsive Dashboard Engine
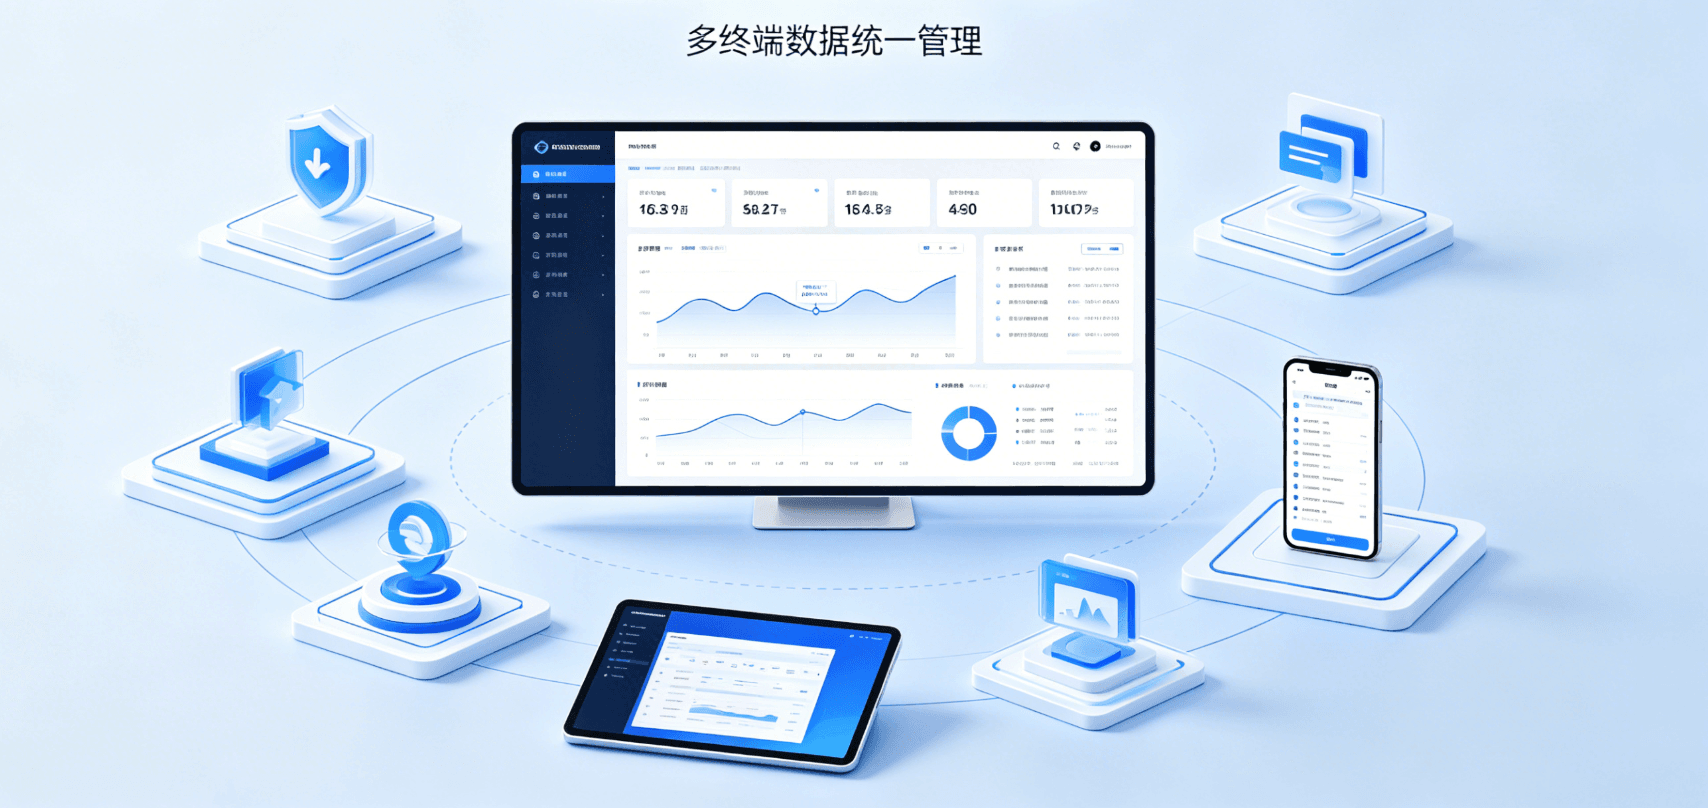
Hengshis dashboard engine is designed responsively from the ground up—not a PC version plus a mobile version, but the same dashboard configuration automatically adapting to different terminal screen sizes.
When a dashboard displays on a PC wide screen, it uses a multi-column side-by-side layout with multiple charts spread across the field of view, supporting mouse hover interactions like hovering to view data details, with reasonable spacing between charts to fully utilize large screen space. When displaying on a tablet medium screen, it automatically contracts to two or three columns, with some detail components like drill-down panels collapsing into floating layers to reduce main view obstruction. When displaying on a phone narrow screen, charts automatically switch to vertical arrangement, displaying one at a time, with KPI numbers enlarged and trend charts displayed vertically, and tables automatically converting to card-style layouts to suit narrow-screen reading.
2.2 Touch-Optimized Interaction
Mobile interaction fundamentally differs from PC: cannot use mouse hover, cannot use right-click menus, and finger tap areas need to be sufficiently large. Hengshi has made dedicated touch optimizations: chart data point tap areas are enlarged to prevent fingers from missing them, long-press replaces hover for viewing data details, switching between charts changes to swipe page operations, and all interactive buttons and filter control sizes are adapted to thumb operation areas.
2.3 Unified Rendering Pipeline
The key to multi-platform consistency lies in the rendering pipeline. Hengshis approach: metric data is computed and output uniformly from the Metrics Platform, regardless of which device it is ultimately displayed on; visualization configurations (chart types, color mappings, filter conditions) are stored as declarative configurations and shared across platforms; terminal-side is only responsible for rendering configurations as UI adapted to the current device, without independently maintaining data or computing logic. As long as configurations remain unchanged, data displayed on different platforms is guaranteed consistent—because this consistency is guaranteed by technical architecture, not by manual verification.
3. Three Embedding Modes, From Light to Heavy
3.1 iFrame Embedding: Simplest One Line of Code
If you only need to embed existing dashboards into internal OA or portals, iFrame is the most suitable approach. You basically only need to specify the embedding address plus token authentication, dashboard ID, and app ID to complete the embedding.
This approach requires no SDK installation, no additional frontend development, and a few lines of HTML complete it. Hengshis iFrame embedding also supports automatic token renewal without regenerating tokens for each embed, and supports cross-domain security controls ensuring only specified parent pages can embed. The disadvantage is relatively limited interaction and difficulty passing complex business parameters or listening to dashboard internal events.
3.2 SDK Integration: Flexible and Controllable
When stronger control is needed—passing dynamic parameters, listening to dashboard events, controlling filters within dashboards—using the SDK provided by Hengshi is recommended.
SDK integration advantages include: flexible parameter passing—can dynamically set filter conditions through code such as default displaying data for a certain region or time period, and can switch data views without refreshing the entire dashboard; event listening capability lets you capture user operations within Hengshi dashboards, such as jumping to the hosts business details page when a user clicks a data point in a chart; through the host applications currently logged-in user identity information, Hengshi-side token issuance and identity mapping are automatically completed without users needing to know Hengshi exists; which dashboard to view, what parameters to apply, and which page element to embed into are all configured through a few items at initialization; the same embedded instance can also dynamically switch dashboards without reinitialization, suitable for scenarios needing to switch between multiple dashboards within one page.
3.3 API Integration: Deep Customization
For scenarios requiring completely custom UI—such as replicating Hengshi chart components in your own system or rendering data in your companys own design language—you can use Hengshis API to obtain raw data and render it in your own frontend framework. This approach has the highest flexibility but also the largest development workload. It is generally only recommended when both iFrame and SDK modes cannot meet requirements.
4. Enterprise IM Integration: WeChat, DingTalk, Feishu
4.1 Why Enterprise IM Is the Best Entry Point for BI
Enterprise IM has two unique advantages. High coverage: almost all employees open enterprise WeChat, DingTalk, or Feishu daily—no need to cultivate new usage habits. Timely message delivery: push notification open rates are far higher than email, and anomaly alerts go directly to IM group chats rather than through the BI platform.
4.2 Message Card-Style Data Push
The traditional approach is sending a text message with a link for users to click and view. But link open rates are usually very low. Hengshi supports card-style message push: directly displaying a data micro-card in enterprise IM, containing the most core KPI number, a mini trend arrow (up or down), and a brief anomaly explanation. Users do not need to click a link to see key information right in the chat interface. Users only click the card to open the full dashboard when they need in-depth analysis.
4.3 Direct Q&A in IM
Leveraging Hengshi ChatBIs dialogue capability, enterprises can integrate data analysis bots into enterprise WeChat groups. Users directly send messages in the group such as yesterday East China sales or this month Top 10 stores, and the bot returns analysis results directly in the group. In multi-round dialogue, they can also follow up and drill down within the same topic.
4.4 Scheduled Push and Anomaly Alerts
Hengshi provides two IM integration mechanisms: scheduled push and anomaly alerts. Daily morning reports push on a schedule—for example, sending a uniformly formatted data morning report in the enterprise WeChat group every morning at 8 AM. Anomaly alerts trigger in real-time—for example, when gross margin falls below a certain threshold, the system immediately pushes an alert message with the anomalous metric and reference data.
5. Mobile App Integration
If an enterprise has its own mobile app, Hengshi provides a mobile SDK for deeply embedded BI dashboards. Main capabilities include: offline caching—data and charts for dashboards users have opened are automatically cached locally in Wi-Fi environments, allowing viewing of recent data even in subways or elevators with poor signal; gesture interaction—supporting left-right swipe switching between dashboards, chart area zoom and drag, and native carousel selectors for filter options; push notifications directly to dashboards—tapping a push notification opens the corresponding dashboard and automatically positions to the anomalous data point without manual searching; native performance—chart rendering uses device GPU acceleration, and large-data-volume table pagination renders smoothly without lag.
6. External Embedding: SaaS Product Data Analytics Value-Add
6.1 Providing Data Dashboards for Your Customers
Many SaaS products face a common value-add challenge: customers constantly ask how are my data looking. Hengshis BI PaaS solution lets your customers see exclusive data analytics dashboards in their own backends.
The key technical challenge is data isolation: customers must only see their own data. Hengshis multi-tenant architecture naturally supports this scenario: each customer corresponds to an independent App space with physically isolated data, and the permission system ensures one customer cannot access other customers data by modifying parameters or URLs.
6.2 White-Label Customization
If your SaaS product has its own brand visuals and wants embedded BI dashboards to match the unified brand style, Hengshi supports white-label customization: dashboard theme colors switch to your own brand colors, logos and brand elements are embedded in dashboard headers or watermarks, and URLs use your own domain without exposing Hengshis domain.
6.3 Usage-Based Billing
For SaaS business models that charge customers per dashboard view, Hengshi provides a usage statistics API—you can query which dashboards each customer viewed, how many queries were generated, and how much computing resources were consumed, and integrate this data into your own billing system.
7. FAQ
Q1: What if mobile dashboard response is slow?
First check whether mobile-specific dashboard configuration is enabled—mobile defaults to loading different chart data and volumes than PC, which can reduce chart count and data volume on mobile. Second, enable data caching and incremental loading to avoid duplicate data requests on mobile networks.
Q2: How to solve cross-domain issues with iFrame embedding?
Hengshis iFrame embedding solution has a built-in cross-domain communication mechanism and does not require additional CORS configuration. If you need to pass complex parameters or listen to events, upgrading to SDK integration is recommended.
Q3: How to maintain data consistency across multiple embedding terminals?
Hengshis unified rendering pipeline ensures all terminals use the same metric computation logic. If you modify filter conditions through the SDK, that change affects only the current sessions data view, not other terminals. If you modify metric definitions, all terminals immediately see the updates.
Q4: How often does IM card message data update?
Scheduled push message data is recomputed at the moment of sending; anomaly alert messages trigger第一时间 when anomalies are detected. If you need to push a real-time updating data card (such as GMV refreshing every second during a promotion), it is recommended to use a card with a link—users click to open the real-time dashboard for the latest data rather than doing second-level refresh within the card.
Conclusion
The core of multi-platform embedding is not technical implementation difficulty, but product design philosophy. Hengshi BI design philosophy: data capabilities should be available like utilities whenever needed, not restricted to a specific terminal. Whether in managers mobile phones on the road, operations staff in enterprise WeChat groups, or customers in your SaaS backend dashboards, data should appear in the most natural way in the place it is most needed. This everywhere BI reach capability is redefining the depth and breadth of enterprise data-driven decision-making.