
Article body
Full article
Abstract: A complete BI analysis pipeline—from data preparation to metric modeling to visual delivery—involves an extremely broad skill stack. A single large model Agent struggles to handle this multi-stage, multi-role complexity. Hengshi Data Agent Family’s three Agents—Data Q&A Agent, Modeling Agent, and Visualization Agent—each specialize in one stage through a “specialized collaboration” design, connected seamlessly via a unified metric semantic layer and tool protocol. This article breaks down the complete three-Agent collaboration chain with real business scenarios, and explores integration patterns with external Agent platforms like Dify and Coze.
I. The Limits of Single-Agent: Why BI Scenarios Need “Splitting”
In the early practice of ChatBI, a common assumption was that a sufficiently smart general-purpose Agent could handle all data analysis needs. But in actual deployment, this assumption is challenged on multiple levels.
The first is skill stack conflict. Preparing data requires understanding database schemas and handling missing values and outliers—this is a data engineering skill. Defining metrics requires understanding business definitions, establishing calculation logic, and mapping lineage relationships—this is a data governance skill. Creating visualizations requires considering chart type selection, layout design, and interaction logic—this is a data visualization and front-end development skill. These three skill stacks are difficult to combine in one person, let alone stuff into a single Agent.
The second is context pollution. If one Agent simultaneously handles data ETL, metric modeling, and dashboard design, its context window will be flooded with instructions and intermediate results from different domains. Each additional stage reduces the density of effective information and degrades reasoning quality.
The third is reliability issues. In a single-Agent architecture, any single-stage failure causes the entire chain to fail, and it is difficult to pinpoint which stage caused the problem when failures occur. In a multi-Agent architecture, each Agent runs independently, failures are naturally isolated, and problems can be quickly attributed to a specific Agent for targeted optimization.
Hengshi’s answer: not to build one “super Agent,” but to cultivate three “specialized Agents” each with their own strengths, working together like a well-coordinated team.
II. Three-Agent Role Definitions: Dividing by “Cognitive Level,” Not Process Steps
II.1 Data Q&A Agent: The “Translator” of the Data World
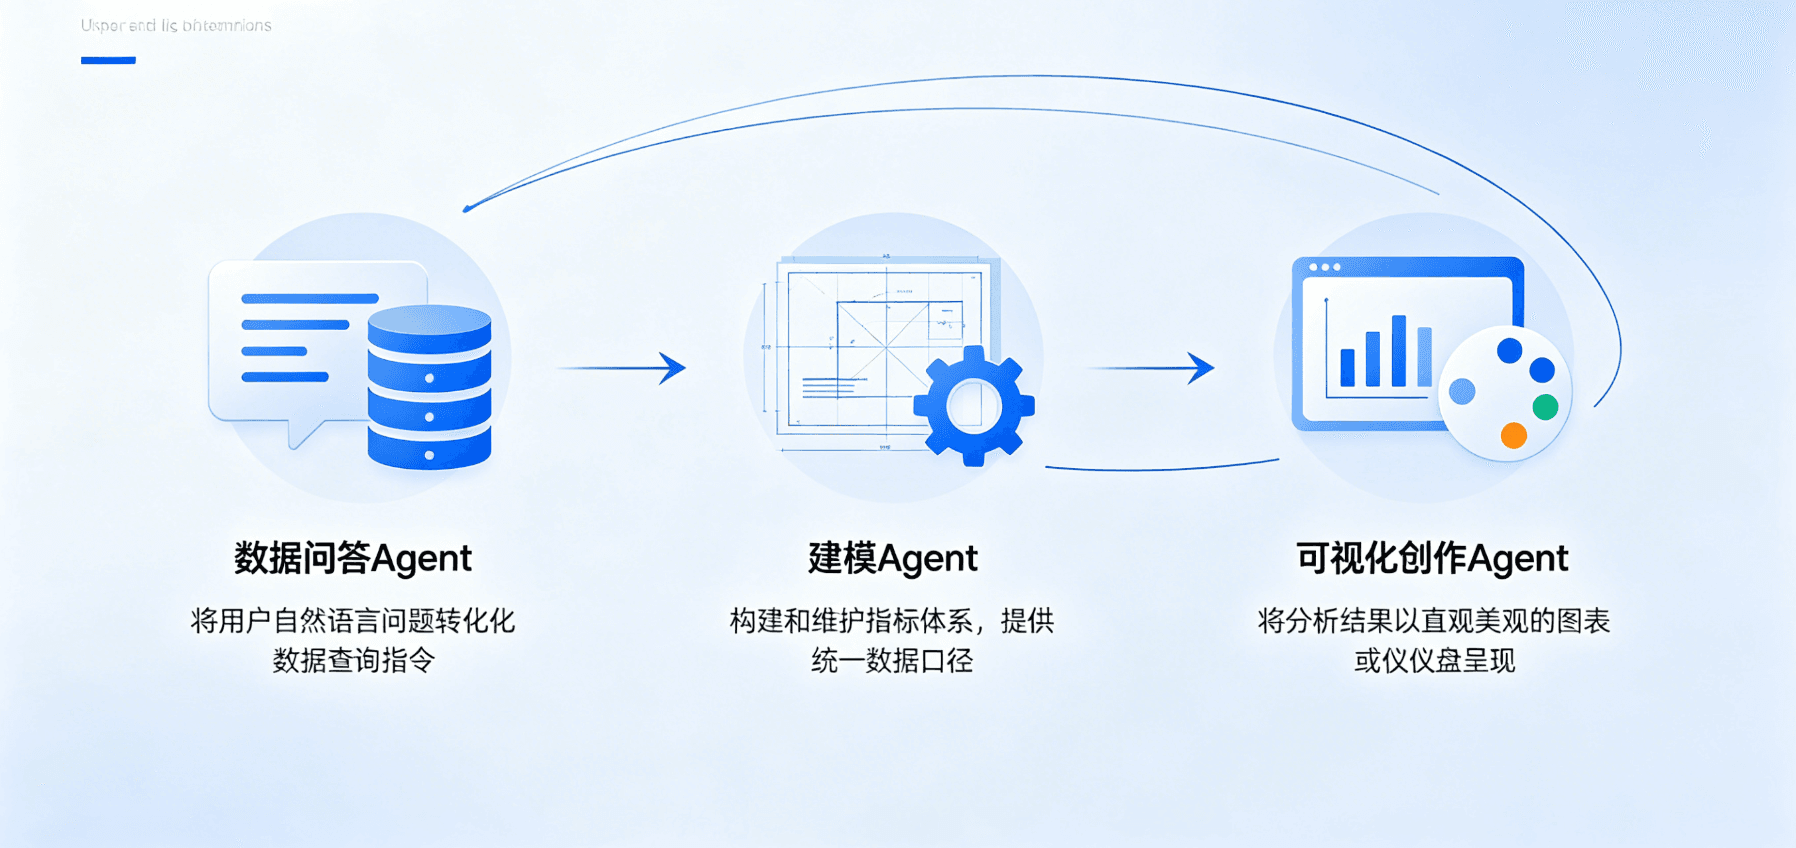
The Data Q&A Agent’s (Agent 01) core responsibility is translating business users’ natural language needs into data-level operational instructions. It does not understand “how to write this SQL,” but “what data does the user want, where is that data, and how should it be retrieved.”
Its typical workflow: when the user says “I want to see the sales trend for the last six months,” the Agent does not immediately think about SQL. Instead, it first identifies which metrics “sales” corresponds to (sales amount, order volume, customer unit price, etc.), then understands the temporal semantics of “last six months,” then determines which tables and fields the data resides in, and finally calls a tool to execute the query.
The Data Q&A Agent is not responsible for generating final analytical conclusions or visualizations. It only does one thing—accurately and securely retrieve the correct data.
II.2 Modeling Agent: The “Architect” of the Metric System
The Modeling Agent’s (Agent 03) task is to help users build and maintain the metric system. Here “modeling” does not mean machine learning modeling, but BI-domain data modeling—defining the calculation logic of metrics, hierarchical relationships of dimensions, and lineage relationships between metrics.
For example, when a user says “Help me define a new metric—Customer Lifetime Value,” the Modeling Agent guides the user to think: What is the definition of CLV? (Is it historical cumulative purchase amount or predicted value?) How long is the calculation period? (Full lifecycle or last 12 months?) What tables and fields are the data sources? How does it relate to other metrics? (Does CLV derive from customer unit price and repurchase rate?)
The Modeling Agent’s output is not dashboards or reports, but structured metric definitions. These definitions are written into the metric semantic layer and become the unified definitions for all subsequent analyses. The Modeling Agent can be thought of as the “foundation construction team” of the entire Data Agent system.
II.3 Visualization Agent: The “Stylist” of Analysis Results
The Visualization Agent (Agent 02) is responsible for presenting analysis results in the best possible visual form. Its core capabilities include: recommending the most appropriate chart type based on data type and analytical goal, automatically designing dashboard layouts, and supporting natural language adjustment of chart styles and layouts.
Its unique value lies in lowering the barrier to visualization. In traditional BI, creating a good-looking dashboard requires both data analysis ability and design ability—a rare combination. The Visualization Agent allows business users to simply describe what they want to see, and the Agent handles the rest.
III. Collaboration Pattern 1: Serial Pipeline—End-to-End from Data to Dashboard
This is the most classic collaboration pattern, suitable for scenarios requiring completing a full analytical task from scratch.
Scenario: The Marketing Director asks, “Help me create an East China Q2 sales performance analysis dashboard.”
Collaboration Flow:
Step 1: The Visualization Agent receives the user’s creation request, but discovers it doesn’t have ready data—it needs to ensure data readiness first. So it sends a collaboration request to the Data Q&A Agent: “Please prepare an East China Q2 sales dataset, including sales amount, order volume, and customer unit price, broken down by region and category.”
Step 2: The Data Q&A Agent parses this request. It queries the data catalog, finds the sales detail table and region dimension table. It confirms the current user has permission to view East China data. It calls the query tool, pulling data filtered by East China region and Q2 timeframe (April–June), aggregated by region and category.
Step 3: The Data Q&A Agent returns the prepared dataset to the Visualization Agent. Data is passed in structured tabular form.
Step 4: The Visualization Agent receives the data and begins analyzing. It discovers the data contains time series (monthly trends) and categorical data (region and category), so it plans the dashboard layout: monthly sales trend line chart at the top, bar chart of sales by category in the middle-left, pie chart of regional sales proportion in the middle-right, and a detail table at the bottom.
Step 5: The Visualization Agent renders the dashboard, presents the initial version to the user, and initiates interaction: “This is the initial version of the East China Q2 performance dashboard. Would you like to adjust chart styles or layout?”
IV. Collaboration Pattern 2: Star Scheduling—Metric System Building Centered on the Modeling Agent
This pattern is suitable for enterprises in the metric system building stage, with the Modeling Agent as the core node and other Agents providing auxiliary support.
Scenario: A retail company’s CIO drives an “AI-Ready Data” initiative to establish unified metric definitions on the Hengshi platform.
Collaboration Flow:
The Modeling Agent, as the leader, first collaborates with the Data Q&A Agent to understand what data sources exist, what table fields are available, and what existing metrics are defined. The Data Q&A Agent uses its Schema probing feature to scan data sources and return a structured data catalog.
Then the Modeling Agent dialogues with business owners to define core metrics one by one. For each metric defined, the Modeling Agent automatically checks its dependency relationships—if “customer unit price” is defined as “sales amount divided by order count,” it automatically links to the existing definitions of sales amount and order count.
After metric definitions are complete, the Visualization Agent is called upon to generate a metric overview dashboard, presenting the full scope of the newly established metric system for business acceptance and confirmation.
V. Collaboration Pattern 3: Federated Collaboration with External Agent Platforms (Dify/Coze)
The combination of Hengshi Data Agent and HENGSHI CLI can essentially be viewed as a “BI execution terminal.” This terminal can be embedded in a larger Agent ecosystem as a tool node for external Agent platforms like Dify and Coze.
V.1 Integration Architecture
External Agent platforms (such as Dify workflows) are responsible for understanding users’ macro intent and orchestrating business processes, while Hengshi Data Agent is responsible for BI-domain professional analysis and data operations. The two connect via API or CLI interfaces, with Hengshi exposing standard tools like “query data,” “create dashboard,” and “define metric,” which external Agent platforms call just like any other tools.
V.2实战案例:智能运营分析工作流
Suppose an enterprise builds an “Intelligent Operations Analysis” workflow using Dify:
Step 1: The Dify workflow is triggered on a schedule (e.g., every morning at 8 AM).
Step 2: Dify calls Hengshi Data Agent’s data Q&A tool to pull yesterday’s omni-channel sales, traffic, and conversion data.
Step 3: After Dify receives the data, it passes it to an internal “anomaly detection” module (which may be a rule engine or AI model) to identify anomalous metrics.
Step 4: If an anomaly is detected, Dify calls Hengshi Data Agent again: “East China yesterday’s sales dropped 30% year-over-year. Please perform root cause analysis.”
Step 5: Hengshi Data Agent performs multi-dimensional drill-down—break down by category, by store, by time period—to find the key anomaly point (e.g., “a large store had a system failure causing data loss”), and returns analytical conclusions.
Step 6: Dify formats the analysis results into a daily report and pushes it to relevant personnel via enterprise WeChat.
In this scenario, Hengshi Data Agent is not the controller but an expert node—it doesn’t need to understand email sending logic or scheduled triggering mechanisms; it focuses exclusively on doing BI analysis well.
VI. Key Technical Mechanisms for Multi-Agent Collaboration
VI.1 Unified Metric Semantic Layer: The “Common Language” Between Agents
The most critical infrastructure enabling seamless collaboration between three Agents is the metric semantic layer. It plays the role of “common language” between Agents. Data queried by the Data Q&A Agent is labeled with metric definitions; metrics defined by the Modeling Agent are persisted in the semantic layer; charts displayed by the Visualization Agent automatically associate with metric definitions. The three Agents don’t need to understand each other’s “dialects”—they all speak “metrics.”
VI.2 Shared Analytical State: The “Handoff Form” Between Agents
What Agents pass to each other is not just data, but “analytical state.” Which business domain is currently being analyzed, what filter conditions have been applied, what the user’s focus is—these meta-informations are passed along during Agent handoffs. Like a hospital registration form: different department doctors, after seeing the registration form, know what examinations the previous doctor performed and what the preliminary diagnosis was, without having to ask the patient from scratch.
VI.3 Fault Isolation and Graceful Degradation
A key advantage of multi-Agent architecture is fault isolation. If the Visualization Agent encounters performance issues, it does not affect the Data Q&A Agent continuing to provide query services. If the Modeling Agent is under maintenance, users can still query existing metrics through the Data Q&A Agent. The system will not fail entirely due to one Agent’s exception—a critical capability for enterprise applications.
VII. Insights for Technical Teams: How to Plan Your Own Agent Architecture
First, split by cognitive level, not by functional module. The split between Data Q&A, Modeling, and Visualization is not divided by technical modules like database tables, ETL pipelines, or chart engines, but by the three cognitive levels of “understanding data,” “defining logic,” and “presenting results.” Each Agent corresponds to a person’s cognitive role, not the packaging shell of a technical component.
Second, define clear “won’t do” boundaries for each Agent. The Data Q&A Agent won’t try to build metrics; the Modeling Agent won’t try to draw charts; the Visualization Agent won’t try to change data metric definitions. This “capability constraint” is not a flaw but a prerequisite for ensuring reliable collaboration.
Third, achieve interoperability through a shared semantic layer, not shared code. The three Agents do not share codebases or memory. Their interoperability is achieved through the metric semantic layer, standard tool protocols, and analytical state. The lower the coupling, the greater each Agent’s independent evolution space.
VIII. FAQ
Q1: Does multi-Agent collaboration increase latency?
Multi-Agent coordination does involve more internal communications than a simple single-Agent single-step response, but these communications are typically controlled at the millisecond level. The dominant factor in overall latency remains data query time, not Agent communication.
Q2: If I only need the data Q&A function, must I deploy all three Agents?
No. The three Agents in Hengshi Data Agent are independently deployable. If you only have data Q&A needs, you can deploy only the Data Q&A Agent. The prerequisite is that your data already has a clear metric semantic layer (which can be built through the Modeling Agent or defined manually).
Q3: Can multiple Hengshi Agents be called as independent nodes in a Dify workflow?
Yes. All three Agents in Hengshi Data Agent can be registered as independent tool nodes in Dify. You can design a Dify workflow that calls the Data Q&A Agent in the first step and the Visualization Agent in the second step, entirely customized to your business logic.
Q4: Which Agent initiates collaboration among the three?
It depends on the scenario. In pipeline mode (e.g., fetch data first, then create visualization), the Visualization Agent initiates scheduling. In exploratory analysis (e.g., metric modeling plus verification), the Modeling Agent leads. In direct user Q&A scenarios, the Data Q&A Agent responds and judges whether other Agents need to participate. There is no fixed “main Agent”—whoever is better suited for the current task does the scheduling.
Conclusion
Multi-Agent collaboration is not technical showmanship but an engineering response to the objective reality that BI analysis pipelines are too long and skill stacks too diverse. Hengshi Data Agent Family’s practice demonstrates that having three specialized Agents “work together in their own lanes” is more feasible, more reliable, and easier for enterprise customers to understand and trust than trying to train one all-powerful super Agent.
In Agent architecture design, “splitting correctly” matters more than “doing more.”