
Article body
Full article
Building an Enterprise BI System from 0 to 1: A Complete Methodology with Hengshi
Abstract: Most enterprises approach BI by first buying a tool, then scrambling to fix data, and finally searching for users—only to end up with a purchased tool, messy data, and underutilized potential. In serving hundreds of enterprise customers, Hengshi has distilled a BI system-building methodology centered on “Metrics First, Data Gradual, AI Accelerated.” This article skips product features and focuses entirely on the complete path of using Hengshi to build a BI system.
1. Common Misconceptions in Enterprise BI Implementation
Before diving into the methodology, lets look at the three most common pitfalls.
Misconception 1: Tool-first, requirements-later. Many enterprises first purchase a BI tool, then ask each department what they want to see. The result: four departments provide twenty different definitions of sales revenue. BI isnt even live yet and already stuck in definitional disputes. The correct sequence is: first define core metrics and unify definitions, then select a tool.
Misconception 2: Perfectionism—do it all at once. Some enterprises want a unified BI platform and attempt to migrate all reports accumulated over three years to the new platform at once. The result: project cycles stretch too long, business stakeholders cant wait, and after half a year theres still no usable output. Confidence evaporates.
Misconception 3: Tech-driven, business-absent. The IT department leads BI construction, only to discover after completion that business departments dont know how to use it or dont want to use it. The final result: dashboards are live, but nobody looks at them.
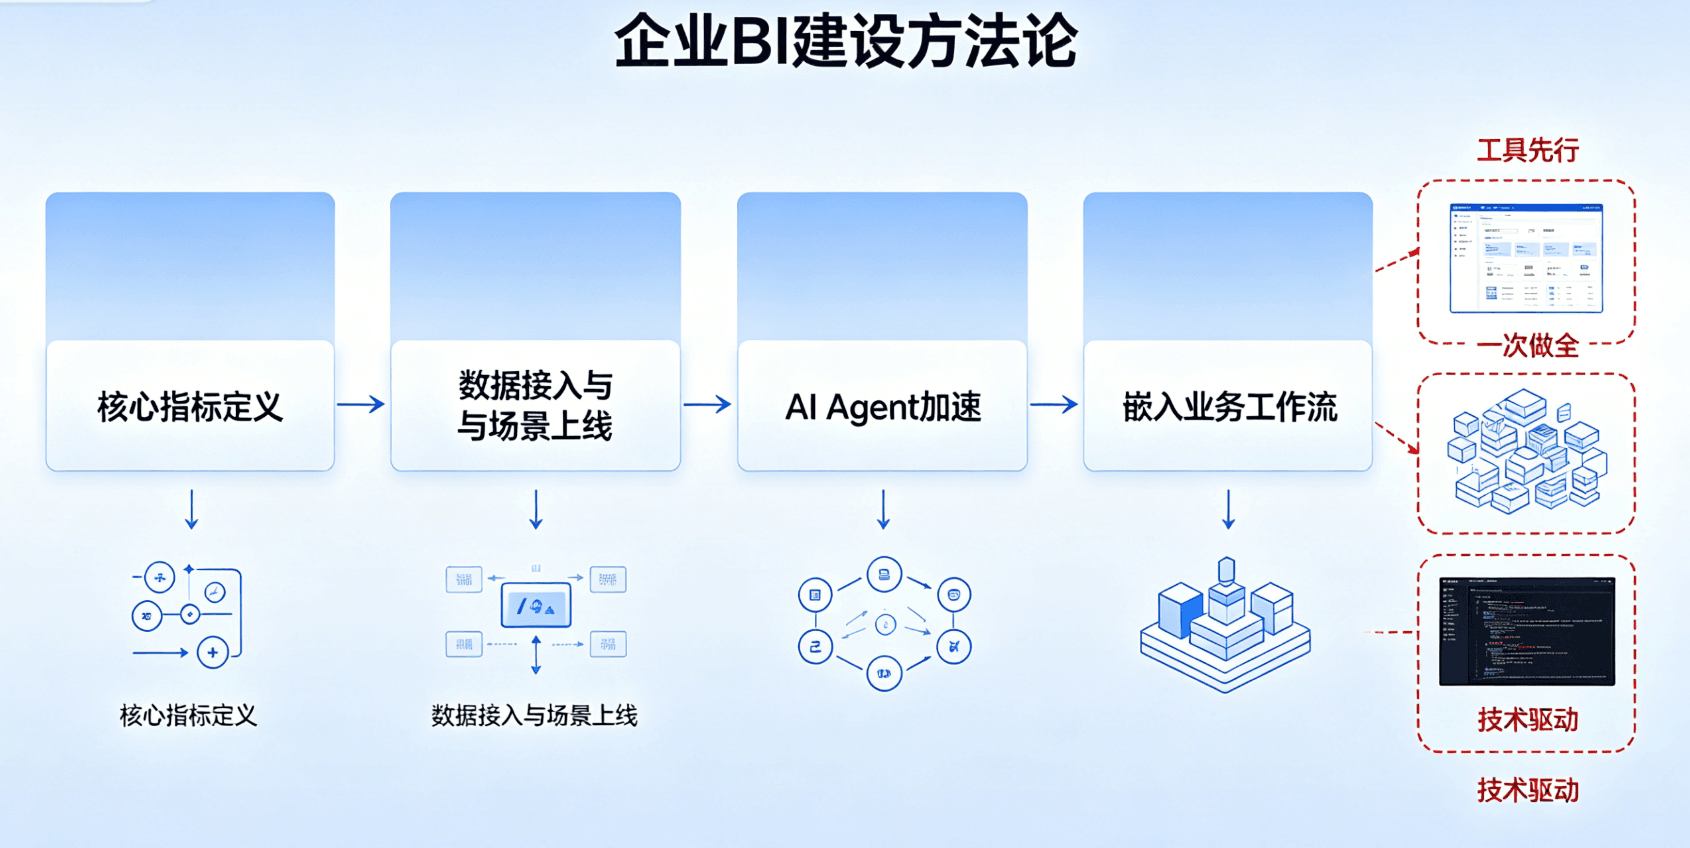
Hengshis core methodology principle: Metrics definition is the foundation, business scenarios are the guide, and AI is the accelerator. Below we break down the complete path across four phases.
2. Phase Zero: Clarify Why You Are Doing BI
This is not a philosophical questionbut a calibration of budget and expectations.
Enterprises need to clarify three key questions. First, what is the core objective of BI construction—is it to improve frontline business staff self-service analytics capabilities, support management data-driven decision-making, or meet customer/partner data dashboard needs? Second, where is the biggest data pain point currently—is data scattered across systems without integration, report development speed unable to keep up with business changes, metric definition inconsistencies where different departments calculate the same metric differently, or does management need more intelligent anomaly detection and root cause analysis? Third, what is the organizational readiness—is there a full-time or part-time data team, does the business department have data analytics foundations, and how strong is management commitment to data-driven decision-making?
The answers directly affect subsequent path choices. If the focus is on self-service analytics, the visualization creation Agent gets higher priority; if the pain point is metric definition inconsistency, the metrics platform must come first.
3. Phase One: Metrics First—Start with 10 Core Metrics
3.1 Month-One Sprint: Define Core Metrics
Here is a counterintuitive principle: Start small, not comprehensive.
Select the most mature business line and identify the 10 most frequently used core metrics for that line. For a retail enterprise, these might include: sales revenue, order volume, average order value, gross margin, inventory turnover days, repurchase rate, return rate, store sales per square meter, new member additions, and promotion ROI. For a SaaS enterprise, these might include: MRR, ARR, NRR, customer acquisition cost, LTV, monthly active users, feature adoption rate, ticket resolution time, customer churn rate, and revenue per employee.
Use Hengshis Metrics Platform to define these 10 metrics one by one. Each metric needs four clear elements: name (business-aligned terminology), definition (what counts, what data is included/excluded), data source (field and table names), and calculation logic (SUM, AVG, or composite formulas). The goal at this stage is not to complete everything in Hengshi, but to get the core team aligned on definitions within two weeks.
3.2 The Metrics Platform Capability
Hengshis Metrics Platforms key role is not providing an input interface, but transforming metric definitions into the infrastructure of the entire BI system. Once each metric definition is complete, it gains version control, lineage, and permission attributes—other Agents and users wont see different versions of calculation logic when using this metric; you know the upstream and downstream dependencies; and a user without view permission for a metric simply cannot use it.
3.3 Small-Step Validation
After the 10 core metrics are built, create a Core Metrics Dashboard directly on the Hengshi platform—the visualization creation Agent can generate it in minutes. Present it to business stakeholders—if the core metric data aligns with their understanding, congratulations, the foundation is solid. If not, there is a metric definition problem; fix it immediately and do not proceed to the next phase with incorrect definitions.
4. Phase Two: Gradual Data—Build One Scenario Per Data Source
4.1 Do Not Connect All Data Sources at Once
Many enterprises have a dozen or more data sources combining ERP, CRM, e-commerce backends, and manual Excel files. Do not attempt to connect them all at once—connect one data source and build a complete analysis scenario around it, then move to the next once it is running smoothly.
For example, start by connecting the e-commerce platform data source and completing the E-Commerce Sales Analysis scenario: connect order tables, product tables, and refund tables; build the e-commerce sales-related metrics system (such as e-commerce channel sales, refund rate, SKU performance); create an e-commerce sales dashboard; and let the e-commerce operations team actually use it. Once the e-commerce scenario is stable, connect CRM for the Member Analysis scenario and ERP for the Financial Analysis scenario.
4.2 Unified Access for Heterogeneous Data Sources
Hengshi has built-in connectors covering mainstream databases and data warehouses—MySQL, PostgreSQL, Oracle, Hive, ClickHouse, MongoDB, Elasticsearch, and more. For SaaS tool data sources (such as Salesforce, Shopify, or Feishu Bitable), Hengshi provides API data connectors with customizable data pull logic.
The key technical principle: business staff should not touch data access. Data access is the data engineers job, completed using Hengshis data integration module. Business staff only needs to perform analysis on already-connected datasets. The reason many BI projects fail is asking business staff to simultaneously manage data preparation and analysis—beyond most business peoples capabilities.
5. Phase Three: AI Acceleration—Using Agents to Lower Usage Barriers
The outcome of the first two phases is a BI system with a metrics system, data access, and basic dashboards. Now introduce AI capabilities to solve the using it problem.
5.1 When to Deploy Data Agent
Do not deploy Data Agent from the start. The judgment standard is simple: if your core metrics are clearly defined, basic dashboards are running, and business teams have gotten used to finding data on the BI platform rather than asking for Excel files in WeChat groups, then it is appropriate to introduce Data Agent. If metric definitions are still being disputed, Agents will only make the confusion worse.
5.2 Start with the Visualization Creation Agent
For most enterprises, the first recommended Agent to deploy is the Visualization Creation Agent. The reason is its most intuitive ROI—business staff says I want to see East China monthly sales trends this month, and the Agent returns a usable chart in minutes. Compare that to the traditional process: business staff submits a request to IT, IT schedules it, develops it, delivers it, and revises it—a week has passed. The Agent compresses this cycle to minutes.
5.3 Deploy ChatBI (Data Q&A Agent)
When metric definitions have stabilized (typically after 2-3 months of using the Metrics Platform), deploy ChatBI. The key work is mapping metric semantics to business terminology. For example, in the Metrics Platform the metric is named sales_amount, but business staff say how much did we sell. Hengshis ChatBI needs to establish this mapping between natural language and metric definitions, ensuring that when a user asks how much did we sell, it matches the sales_amount metric.
5.4 Continuous Optimization
AI is not done once deployed. It is recommended to have a data analyst spend one to two hours weekly on metric calibration: reviewing ChatBI historical Q&A logs, finding incorrectly matched cases, and adjusting semantic mappings. The investment is small, but the accuracy improvement is immediate.
6. Phase Four: Embed in Business—Integrating BI into Workflows
6.1 Three BI Embedding Modes
The first is portal embedding, the most common approach—embedding Hengshi dashboards into the enterprise OA or data portal, so employees see the data they need right when opening the portal. Suitable for general scenarios面向全员.
The second is business system embedding—embedding BI capabilities into specific business systems, such as a Customer 360 View in the CRM system or Procurement Analysis in the ERP. This approach has the highest value—business staff do not need to switch to another platform and can complete analysis within their own work interface.
The third is external embedding—exposing data analysis dashboards to external customers or partners. For example, a SaaS product can embed a customers own data dashboard in the customer backend, allowing them to see their own usage and business data. This is an important way to add SaaS product value.
6.2 Hengshis Embedding Solutions
For all three modes above, Hengshi provides out-of-box embedding solutions. iFrame embedding is the simplest—a single line of frontend code completes it, suitable for portal embedding. SDK integration provides finer-grained parameter passing and event listening capabilities, suitable for business system embedding. API integration is the most flexible, suitable for external embedding and deeply customized scenarios.
6.3 Making BI Part of the Daily Workflow
The final recommendation is to make good use of Hengshis scheduled push and anomaly alert features. Most people do not proactively open the BI platform to view data—which is completely normal. But almost everyone checks push notifications on their phone. You can set up a daily data morning report to push to the enterprise WeChat group, so managers can see yesterday core data on their commute. When key metrics show anomalies, automatically push alerts so decision-makers are notified immediately.
7. Common Pitfalls and Avoidance Guide
Pitfall 1: Metric definition phase drags on too long. Some teams try to define all hundreds of company metrics in the platform at once. The correct approach: launch with 10 core metrics first and add more as you go. The Metrics Platform supports iterative updates—it is not frozen after launch.
Pitfall 2: Pursuing comprehensive data source access. Connecting all historical data before starting analysis. The correct approach: connect the last two years is sufficient; add historical data when needed. Data volume and data quality are two different things.
Pitfall 3: Deploying Agents too early. Deploying ChatBI while metrics are still being adjusted. The correct approach: wait until metric definitions have been stable for at least one month before deploying Agents, otherwise business stakeholders will become skeptical of Agent accuracy and promotion becomes difficult later.
Pitfall 4: Only caring about how many dashboards were built. The KPI is not the number of dashboards, but whether the business side actually uses them. Valid metrics are weekly active dashboard count and business decision count driven by dashboards.
Pitfall 5: Never providing feedback on AI analysis results. When ChatBI gives a wrong answer, users quietly leave. The correct approach: establish a feedback mechanism—every AI answer can receive thumbs up/down/correction, and this feedback is valuable material for optimizing metric mappings.
8. FAQ
Q1: Our team has no dedicated data analyst. Can we still do this?
Yes, but the path needs adjustment. Without a data analyst, prioritize the Visualization Creation Agent for reports and dashboard generation. Metric definition work should be taken on by the person who knows the business best (such as the operations manager or product manager) on a part-time basis, keeping the count to 5-8 core metrics—do not aim for too many.
Q2: We already have Power BI or Tableau. Do we still need Hengshi?
This is not about replacement but about supplement or upgrade. If your existing BI tools have pain points in AI analytics, metric definition management, or Chinese-style reporting, you can introduce Hengshi as an incremental module—the same data through the pipeline can supply both BI systems simultaneously.
Q3: How long does the total cycle typically take?
Following the four phases: metric definition 2 weeks, first scenario implementation 3 weeks, AI capability introduction 4 weeks, business embedding 2-8 weeks depending on complexity. The full journey takes approximately 3-4 months to see systematic results, with deliverable outcomes at each phase—you will not spend half a year seeing nothing.
Conclusion
What enterprises fear most in BI construction is not insufficiently advanced technology, but unclear paths and inappropriate pacing. Hengshis product matrix provides a complete capability stack for BI construction, but the product itself cannot replace methodology. Hopefully this from 0 to 1 guide will help you avoid common pitfalls and make your BI system a genuine business asset rather than a liability.