Article body
Full article
I. Understanding BI PaaS: Not a Tool, an Engine
First, clarify a key concept: BI PaaS (Platform as a Service) is not “putting BI tools in the cloud,” but “embedding BI capabilities as a service into other applications.”
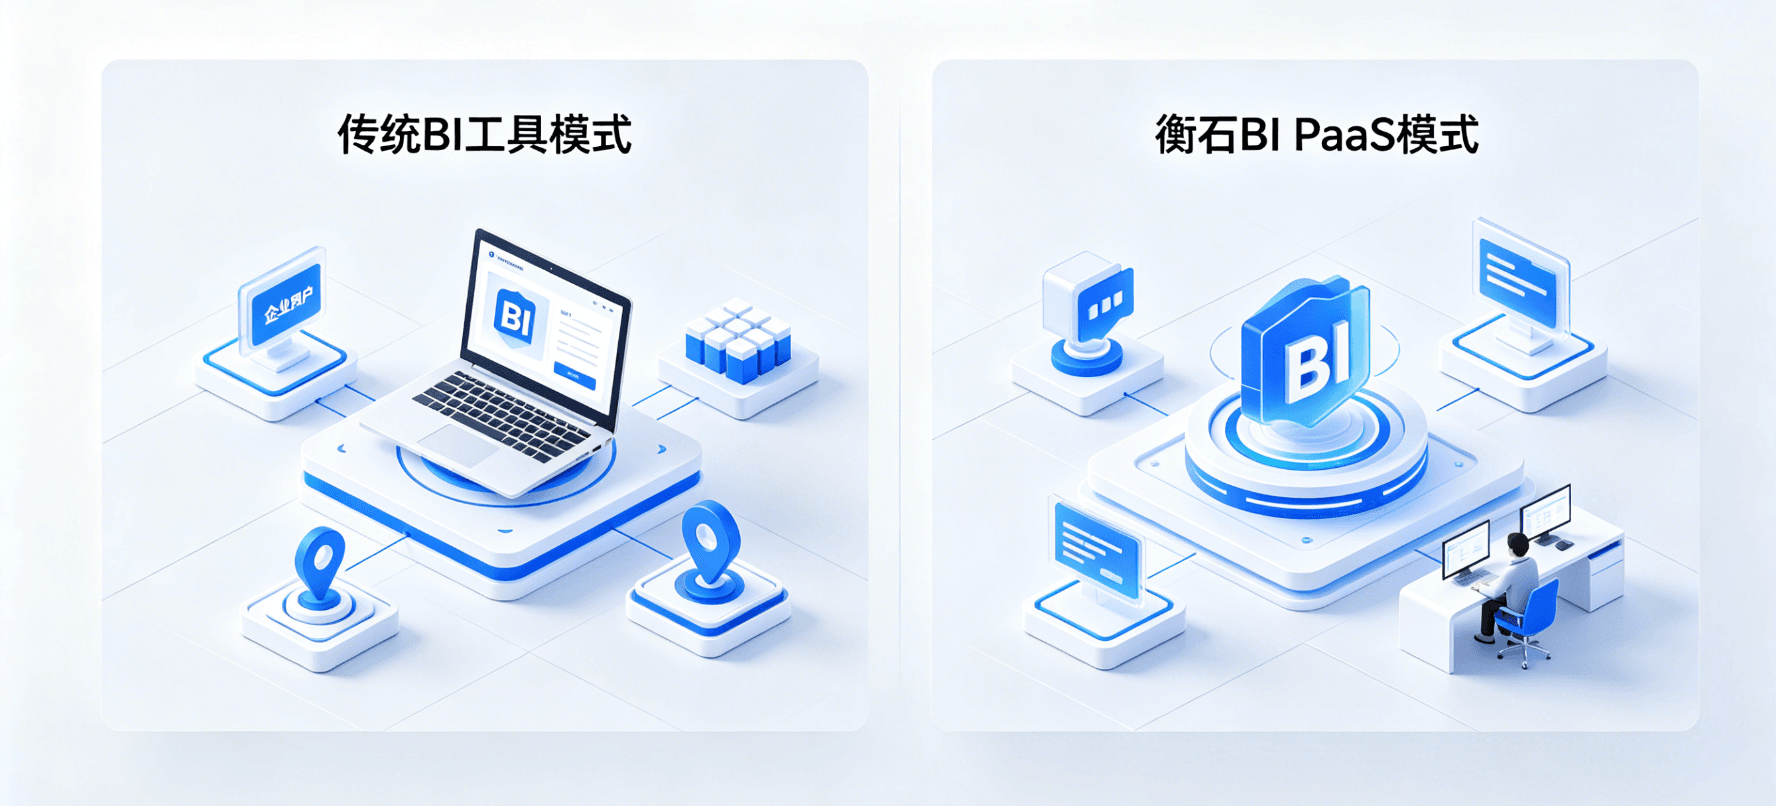
The traditional BI tool model is: vendor develops a BI software → enterprise purchases and installs it → end users view data in this software. HENGSHI’s BI PaaS model is: HENGSHI provides the BI engine → software vendor embeds this engine into their own product → software vendor’s customers view data in their own product.
This difference seems subtle but is actually key:
| Dimension | Traditional BI Tool | HENGSHI BI PaaS |
|---|---|---|
| Buyer | End enterprise | Software vendor (ISV) |
| User | Enterprise employees | ISV’s customers |
| Product Form | Standalone software | Embedded engine |
| Technical Delivery | Installation and deployment | API / SDK / iFrame |
| Permission Model | Single-enterprise hierarchy | Multi-tenant multi-level |
| Business Model | Per user / per year | Per tenant / per usage |
II. Three Embedding Modes: From Shallow to Deep
HENGSHI BI PaaS provides three embedding modes to adapt to different integration depths and customization needs.
Mode 1: Data Application Embedding (Analysis Results Embedding)
Embedding granularity: Embed already-created dashboards and reports into third-party applications.
On HENGSHI side: Create dashboard → Set data permissions → Generate embed link
On ISV side: Load the link in their own application via iFrame or Web Component
Applicable scenarios:
- Fast delivery: ISV analysts create dashboards on HENGSHI platform, publish to product with one click
- Batch distribution: Assign different dashboards and data views to different customers
- Low customization need: End users only need to view and filter, not create new content
Technical highlights:
- Supports data parameter passing: External systems can control dashboard data scope via URL parameters
- Supports UI parameter passing: Control theme, hide menus, lock filters, and other appearance behaviors
- Supports SSO login-free: Embedded dashboards inherit the host application’s authentication status
Mode 2: Function Embedding (Analysis Capability Embedding)
Embedding granularity: Embed HENGSHI’s “analysis capabilities” — not just viewing reports, but also creating reports — into third-party applications.
On HENGSHI side: Provides dataset management, dashboard creation, report design and other functional modules
On ISV side: Embed these functional modules in their own application, end users can self-service create analysis content
Applicable scenarios:
- Self-service analysis: Let ISV’s customers independently create dashboards in their own product
- Personalized analysis: Different customers have different analysis needs, ISV cannot pre-create all dashboards
- Enhance product competitiveness: Add data analytics capabilities to ISV’s product, increase contract value
Technical highlights:
- Supports on-demand selection of functional modules (e.g., only embed dashboard creation, not data connection management)
- Supports multi-tenant isolated creation space: Customer A’s created content is only visible to Customer A
- Supports custom function menus and operation workflows
Mode 3: Deep Integration and Customization
Embedding granularity: Use HENGSHI as the analysis foundation, deeply customize frontend functions and interactions.
On HENGSHI side: Provide all API interfaces and backend engine
On ISV side: Develop custom frontend interface based on HENGSHI's API, completely control user experience
Applicable scenarios:
- Brand integration: ISV wants the analysis module to be completely consistent with their own product in visuals and interactions
- Process embedding: Analysis is not a standalone page, but embedded in business operation workflows (e.g., embedded customer analysis in CRM opportunity pages)
- Customization needs: Requires interaction methods or layouts not natively supported by the HENGSHI platform
Technical highlights:
- All HENGSHI operations provide RESTful APIs, frontend can arbitrarily combine and call them
- Supports Webhook callbacks and event subscriptions
- Supports custom frontend components and theming systems
III. Multi-Tenant Architecture: The Core Challenge of BI PaaS
For ISVs, multi-tenancy is the biggest technical challenge in embedded BI — different customers (tenants) need to use the same BI system, but data and permissions must be completely isolated.
3.1 HENGSHI’s Multi-Tenant Model
HENGSHI organizes tenant relationships at the following levels:
Platform
  ├── Tenant A
  │     ├── Dataset A-1
  │     ├── Metric A-1
  │     ├── Dashboard A-1
  │     └── User Groups A-1, A-2
  ├── Tenant B
  │     ├── Dataset B-1
  │     ├── Metric B-1
  │     ├── Dashboard B-1
  │     └── User Groups B-1, B-2
  └── Tenant C...
Isolation strategies for each level:
| Level | Isolation Method | Description |
|---|---|---|
| Data Source | Tenant-level independent configuration | Each tenant connects to its own database/data warehouse |
| Dataset | Tenant-level creation and management | Each tenant can only see and operate its own datasets |
| Metrics | Tenant-level definition and consumption | Each tenant maintains its own metric system |
| Dashboards/Reports | Tenant-level creation and publishing | Complete isolation between tenants, supports cross-tenant template sharing |
| User Permissions | In-tenant role management | Roles like admin, editor, viewer take effect within tenant scope |
3.2 Core Tenant Management Capabilities
Tenant creation and lifecycle management:
- Supports automatic tenant creation via API (when ISV creates a customer in their own management backend, sync-create tenant in HENGSHI)
- Supports tenant enablement, suspension, and deletion
- Supports tenant-level resource quota control (dataset quantity, dashboard quantity, storage space, etc.)
Tenant templates:
- ISV can create standardized analysis templates (e.g., “SaaS Enterprise Standard Business Dashboard”), one-click apply to new tenants
- Templates automatically complete data source mapping and metric initialization
- Supports template version management; tenants that have already applied can choose to upgrade when templates are updated
Cross-tenant management:
- ISV’s operations team can view usage across tenants in the “super-admin view”
- Supports cross-tenant usage analysis and billing statistics
- Supports cross-tenant operation auditing
3.3 Row-Level Data Permission Control
The final key link in multi-tenant isolation is data permissions. Even within the same tenant, different users may need to see different data (e.g., East China region manager can only see East China data).
HENGSHI supports Row-Level Security (RLS):
- Data filtering based on user attributes (e.g., user.region = ‘East China’)
- Permission rules based on data fields (e.g., sales_rep_id = current_user_id)
- Permission rules can be defined at the dataset level; all dashboards and reports using that dataset automatically inherit them
IV. Integration Technical Details
4.1 Authentication and SSO
ISV Application → User Login → ISV Authentication System → Generate HENGSHI Token → Pass to HENGSHI Embedded PageSupported authentication methods:
- OAuth 2.0: Standard authorization code flow
- SAML 2.0: Enterprise SSO standard
- JWT Token: Lightweight solution for microservice architectures
- Custom Authentication: Implement any authentication integration via API proxy
4.2 Frontend Embedding
iFrame method (simplest):
<iframe
  src="https://bi.your-company.com/embed/dashboard/xxx?token=yyy"
  width="100%"
  height="600">
</iframe>- Advantages: Zero frontend development, any framework supported
- Limitations: Limited cross-domain communication, limited style customization
Web Component method (recommended):
<hengshi-dashboard
  dashboard-id="xxx"
  token="yyy"
  theme="light">
</hengshi-dashboard>- Advantages: Native Web standards, supports Shadow DOM style isolation, supports event communication
- Limitations: Requires modern browser support
4.3 API Integration
All HENGSHI functions provide RESTful APIs; typical usage scenarios:
- Tenant Management: Create tenants, configure data sources, assign permissions
- Content Management: Create/update/delete dashboards and reports
- Data Operations: Trigger data sync, query datasets
- Usage Statistics: Get usage data for each tenant for billing
API responses are uniformly in JSON format, supporting pagination, filtering, and sorting.
V. Typical Integration Scenarios
Scenario 1: CRM Vendor Embeds Sales Analytics
Background: A CRM SaaS vendor wants to provide sales data analytics capabilities for each enterprise customer.
Integration plan:
- Use Mode 2 (function embedding), embed the report designer into the CRM product
- Each CRM customer (enterprise) serves as an independent tenant
- Each tenant connects to its own CRM database
- CRM vendor provides standard sales analysis templates (sales funnel, performance trends, customer distribution)
Effect: CRM vendor doesn’t need to develop BI modules themselves; customers can complete the full process from data entry to analysis within the CRM.
Scenario 2: Low-Code Platform Integrates BI Capabilities
Background: An APaaS (Application Platform as a Service) vendor wants to provide BI capabilities to application builders.
Integration plan:
- Use Mode 3 (deep integration), completely customize frontend interaction via API
- Each APaaS application instance serves as a tenant
- Application builders embed BI components into applications through drag-and-drop
- End users see an analytics experience completely integrated with the APaaS
Effect: The APaaS vendor’s product upgrades from a “build applications” tool to a “build applications with analytics” platform.
Scenario 3: Group IT Unified Analytics Platform
Background: A group company wants to provide a unified data analytics platform for each business department.
Integration plan:
- Use Mode 1 (data application embedding), embed dashboards into the group intranet portal
- Each business department serves as an independent tenant
- Each department can manage its own datasets and metric systems
- Group level can view aggregated data across departments
Effect: Unifies the group’s analytics tools and metric definitions while maintaining each department’s analytics autonomy.
VI. Frequently Asked Questions
Q1: Does the embedded BI module affect the host application’s performance?
A: HENGSHI’s embedding uses asynchronous loading mechanism, which does not block the host application’s page rendering. The BI module’s loading and rendering occur in an independent execution environment, with minimal impact on host application performance.
Q2: What is the upper limit for the number of tenants?
A: HENGSHI’s architecture supports horizontal scaling, with no hard upper limit on tenant count. The actual limiting factor is hardware resources (servers, databases, storage). Under typical configuration, a single cluster can support hundreds to thousands of tenants.
Q3: If an ISV’s customer is already using another BI tool, can they migrate data to HENGSHI?
A: Yes. HENGSHI supports migrating existing data models and report content to the HENGSHI platform through dataset import and API batch migration. However, it is recommended to conduct complete POC verification before migration.
Q4: After integration, can ISV’s customers see the HENGSHI brand?
A: Complete white-labeling is possible. HENGSHI supports replacing all brand elements (Logo, product name, domain name, copyright information) with ISV’s own brand. End users are completely unaware of the existence of the “HENGSHI” brand. This is also one of the core values of the BI PaaS model.
VII. Summary
HENGSHI BI PaaS’s integration scheme is designed around one core principle: Let ISVs have BI capabilities without maintaining a BI system.
The three embedding modes cover the complete needs spectrum from “fast launch” to “deep customization.” The multi-tenant architecture allows ISVs to manage BI tenants as they manage their own customers, and open APIs provide implementation paths for any customization need.
For ISVs and software vendors evaluating BI capabilities, it is recommended to judge whether HENGSHI BI PaaS is suitable from the following angles:
- Do your customers need data analytics capabilities? If yes, is the ROI of self-developed BI modules reasonable?
- Do you need multi-tenant data permission isolation? If yes, is the complexity of self-development acceptable?
- Does your technical team have professional experience in the BI domain? If not, purchasing BI PaaS is more reliable than self-development
- Do you need to launch BI capabilities within half a year? If yes, integrating existing BI PaaS is the only feasible path