
Article body
Full article
Abstract: Business users trust analysis when key numbers can be recalculated, explained, and checked collaboratively. Within authorized data boundaries, HENGSHI SENSE Data Agent supports conversational analysis, metric authoring, dashboard authoring, and intelligent interpretation. Combined with managed metric definitions, lineage accessible to data managers, and clear permissions, these capabilities can produce reusable analytical assets. This article follows the question of how to verify results and presents a practical approach for operations, finance, sales, and data teams.
1. Why an answer still needs verification
“East China sales fell 8% in September compared with August” sounds simple. In a business discussion, it immediately raises questions: Does sales include tax? Are we comparing full calendar months or rolling 30-day periods? Have refunds been deducted? How is East China defined? Do users in different roles see the same scope? Without answers, fluent commentary is difficult to use in business reviews, budget decisions, or customer communication.
Verification turns a judgment about analytical prose into checks of metric definitions, query scope, and the data-processing chain, while letting each role make its own business judgments. This is how Data Agent’s conversational efficiency becomes a reusable organizational capability.
Within the data a user is authorized to access, HENGSHI SENSE Data Agent can retrieve and query content from the data marketplace, application marketplace, and application authoring. It can run one or more queries as needed for complex questions and assist with creating metrics, charts, and dashboards. The purpose is to help teams ask questions, obtain numbers, and prepare analysis faster, then place key findings in a verifiable business framework. Business owners retain responsibility for their judgments.
2. Agree on definitions: turn natural language into checkable analytical objects
Business language is often ambiguous. Revenue, active customers, and in-store conversion can each have several calculation methods. If the system combines fields anew for every question, similar numbers may still be incomparable because time windows, filters, or deduplication rules differ. For recurring questions, establish the definition as a business metric first and maintain terminology, synonyms, and special rules in metric descriptions and dataset knowledge management.
HENGSHI’s metric marketplace lets users browse business and atomic metrics by business topic. Metric details show definitions, lineage, and charts, with access to metric analysis for further exploration. For easily confused concepts such as year-over-year growth, repeat-purchase rate, and ROI, teams should maintain confirmed calculations in metric management instead of leaving them in a single conversation. Data Agent can query, author, and explain using these established business semantics, reducing ambiguity from ad hoc calculations.
| Verification dimension | Questions the business team must resolve | HENGSHI capabilities and references |
|---|---|---|
| Metric definition | Which business metric does the number represent? What are its formula, deduplication rules, and reporting period? | Metric definitions, business topics, and metric analysis in the metric marketplace |
| Query scope | Do time, region, channel, organization, and filters match the question? | Record conditions in the question and verification notes; recheck them in a dashboard or metric analysis |
| Data source | Which dataset produced the result? Did upstream data update on schedule? | Upstream dependencies, update times, and affected objects in data lineage |
| Access boundaries | Should different roles see different scopes? | Permission models, row-permission modeling, and data scope associated with the login identity |
This order also works for everyday troubleshooting: confirm the metric, confirm the scope, check the source, then determine whether permissions explain the difference. Governing definitions before tuning prompts is usually more stable than relying on conversational techniques alone. Official guidance also recommends completing dataset, field, and metric names and descriptions, hiding fields not used in questions, and documenting business terms, definitions, and synonyms in knowledge management.
3. Use lineage to explain where a number comes from
Recalculation means more than entering the same question again. A useful cross-check reaches the same business finding through another inspectable path: confirm a metric definition and open metric analysis for the same period and region, or drill down from a dashboard chart to check grouping and filters against the conversational constraints. If the paths disagree, investigate metric definitions, query parameters, and update times before assuming the model made an arithmetic error.
Data lineage provides data-engineering evidence. HENGSHI lineage shows transformations from source to target, including upstream datasets on which a selected dataset depends, downstream datasets it helps generate, and affected charts, datasets, data integrations, and data models. The lineage graph can also show dataset update times and update-failure indicators. When operations sees an unusual dashboard number, the team can distinguish a changed metric definition, stale upstream data, and a downstream chart using a different dataset.
Data lineage is intended for people with the corresponding management or editing permissions. Application viewers and tenant users cannot see the full lineage. Business users can check visible charts and metric information; authorized data personnel should assist with upstream processing checks. Traceability does not mean exposing underlying details and processing relationships to every recipient.
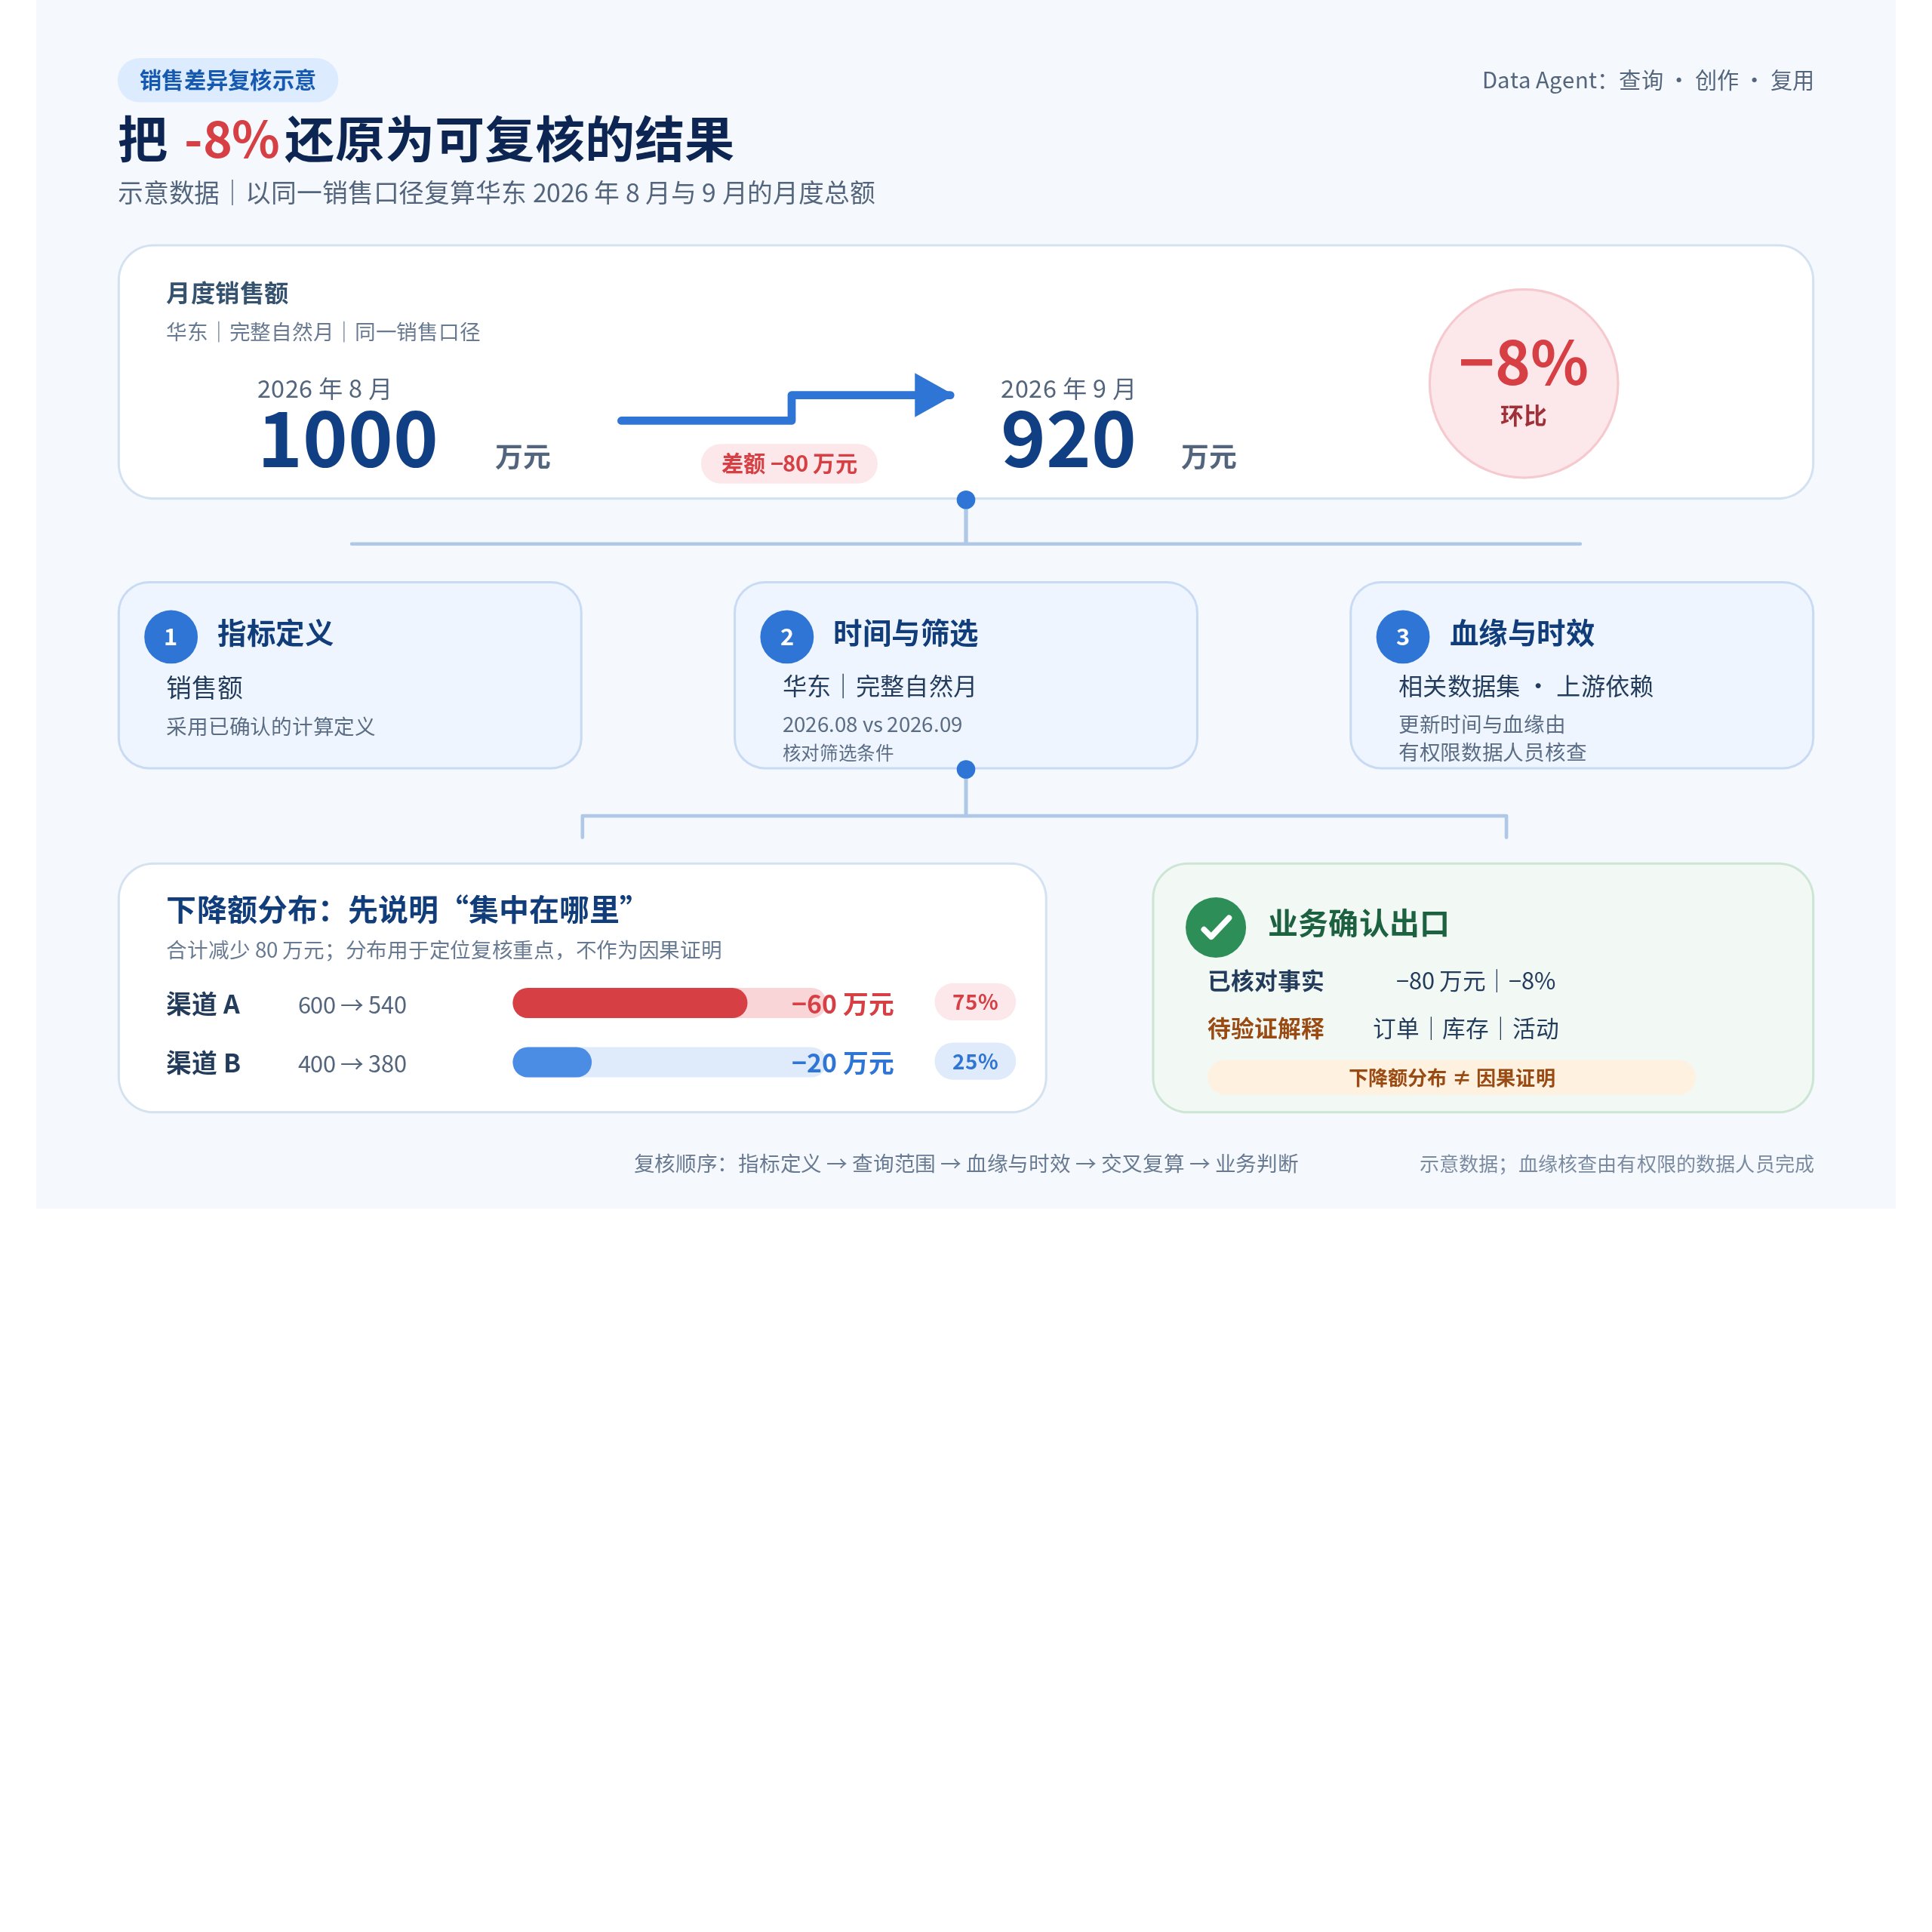
Consider illustrative data using one sales definition: East China records RMB 10 million in August 2026 and RMB 9.2 million in September. The month-over-month change in monthly totals is 920 / 1000 - 1 = -8%, using units of RMB 10,000. If channel A falls from RMB 6 million to RMB 5.4 million and channel B from RMB 4 million to RMB 3.8 million, their decreases of RMB 600,000 and RMB 200,000 reconcile to the total decline of RMB 800,000. A accounts for 75% of the decline, identifying its concentration; explaining the cause still requires order, inventory, or campaign evidence. The months have different lengths, so any discussion of daily averages requires a separate metric with its definition stated.
4. Leave verification notes that others can take over
Before important numbers enter a weekly meeting, business review, or external material, retain a concise verification record. It need not reproduce the entire conversation or present itself as a system-generated audit file. What matters is that the next person can repeat the checks using the same metric, scope, and role boundaries. Pending items are especially useful: they distinguish unconfirmed explanations from verified facts and prevent speculation from becoming a conclusion as it is passed along.
{
  "question": "How did East China sales change in September 2026 compared with August?",
  "verified_metric": "Sales, using the confirmed metric definition",
  "query_scope": "East China; full calendar months of September and August 2026; monthly totals",
  "illustrative_data_RMB_10000": {"previous": 1000, "current": 920, "difference": -80, "month_over_month": "-8%"},
  "verification_path": ["Metric definition", "Recalculation in metric analysis or a dashboard", "Relevant dataset lineage and update times"],
  "confirmed_facts": ["Numerical difference", "Comparison periods", "Data update time"],
  "explanations_to_verify": ["Whether changes in channel composition relate to the difference"],
  "verification_ownership": "Business owners confirm business meaning; data personnel confirm definitions and the data chain"
}
These notes can accompany findings or become part of a team review template. For recurring questions, repeatedly confirmed metrics, filter combinations, and visualizations can be reused in metric boards or dashboards. Data Agent shortens the authoring path from a question to charts, metrics, and dashboards. Verification notes help people find, understand, and use those assets correctly next time.
5. Descriptive interpretation does not establish causation
A common analytical mistake turns “happened together” into “was caused by.” If orders decline in the same week a promotion ends, the relationship warrants investigation; it does not prove that the promotion’s end was the sole cause. Causal judgments often require control groups, experimental design, external-event records, or validation by business experts. These are analytical and decision-making steps that a natural-language answer cannot replace.
HENGSHI intelligent interpretation follows a configured interpretation approach to query live data, identify anomalies, decompose results, and drill down, producing structured descriptive reports about past events and the current situation. The Data Agent manual explicitly states that intelligent interpretation does not make predictive inferences; it describes and summarizes existing and historical data. Business communication should therefore state the observed change and the dimensions to check next, with causal hypotheses listed separately for validation.
| Analytical statement | What can be concluded | Next verification step |
|---|---|---|
| “East China sales fell compared with last month” | A descriptive fact once the metric, time, and region have been checked | Recalculate and check filters and update times |
| “The decline is concentrated in a particular channel” | A distribution pattern worth attention once dimensional results have been checked | Check channel definitions, sample sizes, and cross-analysis with other dimensions |
| “A campaign caused sales to fall” | Correlated changes in the same period alone cannot establish this conclusion | Add campaign records, comparative analysis, or validation organized by the business owner |
Data Agent helps teams obtain facts, create charts and reports, and break down further questions. The team owns causal judgments, strategy selection, and business action. Queries, visualizations, and metric authoring can reuse platform assets, making findings easier to discuss and reuse.
6. Permission differences are part of the result
Different answers under different login accounts do not necessarily indicate an error. HENGSHI’s permission model distinguishes application-author, dataset-author, and user modes. User mode determines visible data using the current login identity. In collaboration, first establish whether everyone should see the same scope before comparing final numbers. If data must be dynamically restricted to each user, define row permissions, connection permissions, and the modeling relationship between fact and permission tables during implementation.
Result verification therefore needs clear role assignments: business users ask questions and confirm business meaning, analysts check metrics and filters, data personnel inspect datasets, lineage, and update status, and administrators maintain roles and permission rules. Data Agent improves each role’s query, authoring, and interpretation efficiency within authorized boundaries, while the organization retains responsibility for data access and business decisions.
7. Move from a single question to reusable analytical assets
A trustworthy result should lead back to metrics, datasets, and dashboards, beyond a single chat record. HENGSHI combines conversational analysis and assisted authoring in Data Agent, shared metrics organized by topic in the metric marketplace, data lineage for processing paths and impact, and permissions that keep use within the right scope. Querying, authoring, verification, and reuse become a continuous process.
A practical implementation sequence is straightforward: choose three recurring business questions and document their metrics and common filters; have the data team complete dataset knowledge and field and metric descriptions; use Data Agent to produce initial conversational analyses and visualizations; let business and data staff verify them together using the checklist; then retain stable definitions, charts, and dashboards as reusable assets. This preserves conversational speed while giving key numbers a sound business basis.
When numbers can explain their definition, scope, source, and role boundaries, Data Agent offers more than quick answers. It connects business questions, analytical authoring, and data governance so follow-up questions have a path, recalculations have evidence, and each review leaves assets for future use.