Article body
Full article
Abstract: When selecting BI tools, enterprises are easily attracted by flashy visualization dashboards, yet overlook the most fundamental daily business need—reporting. HENGSHI BI PaaS platform treats enterprise reporting as one of its four core modules, supporting complex Chinese-style reports and Excel-like interactive operations. This article interprets HENGSHI enterprise reporting design thinking and application scenarios across three dimensions: technical architecture, reporting capabilities, and embedding modes.
I. An Overlooked Infrastructure: Why Enterprise Reporting Still Matters
In the AI BI boom, there’s a trend worth being wary of: many BI vendors pour all their energy into AI conversation and large-screen visualization, weakening the most basic and most essential reporting capability. Yet in real enterprise operations, reporting remains the highest-frequency form of data consumption.
The Special Nature of Chinese-style Reports:
Unlike Western enterprises that prefer clean dashboards and data visualization, Chinese enterprises universally have “Chinese complex report” needs—
- Multi-level headers (row headers + column headers with multi-layer nesting)
- Cell merging with cross-row and cross-column layouts
- Cross-tabulation and grouped summaries
- Pixel-precise layout requirements
- Excel-like cell editing and formula calculations
These needs are often difficult to satisfy in lightweight BI tools, forcing enterprises to switch repeatedly between BI tools and Excel. HENGSHI’s enterprise reporting module was designed to solve exactly this problem.
II. HENGSHI Enterprise Reporting Capability Matrix
II.I Chinese Complex Reports
The HENGSHI reporting engine natively supports all elements of Chinese complex reports:
| Capability | Description |
|---|---|
| Multi-level headers | Supports bi-directional multi-layer nested row and column headers, each layer independently settable for merging, styling, and filtering |
| Cell merging | Supports horizontal, vertical, and rectangular region merging, with automatic data aggregation after merging |
| Cross-tabulation | Supports row dimension + column dimension cross summaries, auto-generating subtotals and grand totals |
| Grouping and pagination | Auto-groups and paginates by business dimensions (e.g., region, product line) |
| Conditional formatting | Supports data bars, color scales, icon sets, and other visual conditional formatting |
| Precise layout | Supports pixel-level adjustment of column widths, row heights, fonts, borders, and alignment |
II.II Excel-like Interactions
HENGHSHI reporting supports Excel-like cell editing operations, including:
- In-cell editing: Directly modify data in reports (with permission), just like operating Excel
- Formula calculation: Supports Excel-like formula syntax to define calculated columns in reports
- Data drill-through: Click on aggregated values to drill down to detail data
- Linked filtering: When one report’s filter conditions change, linked reports auto-refresh
- Export: Supports export to Excel, PDF, and CSV, preserving layout precision
II.III Parameterized Reports
Reports aren’t static—they can change dynamically based on parameters—
- Time parameters: Auto-generates time ranges such as “this month,” “this quarter,” and “YoY” based on the current date
- Business parameters: When users select region, product line, or customer group, reports auto-filter by selection
- Cascading parameters: After selecting “province,” the “city” dropdown automatically shows cities in that province
- Default parameters: Each report can set default parameter values for immediate use upon opening
II.IV Report Scheduling and Distribution
Reports aren’t just for online viewing—
- Scheduled generation: Auto-generate reports daily/weekly/monthly/quarterly
- Multi-format output: Excel, PDF, HTML, images
- Auto-distribution: Auto-push to designated personnel via email, WeCom, and DingTalk
- Subscription management: Users self-subscribe to needed reports, managing push frequency
III. Embedded Reporting: Designed for ISVs and SaaS Vendors
The biggest differentiator of HENGSHI’s enterprise reporting module is its embedding capability.
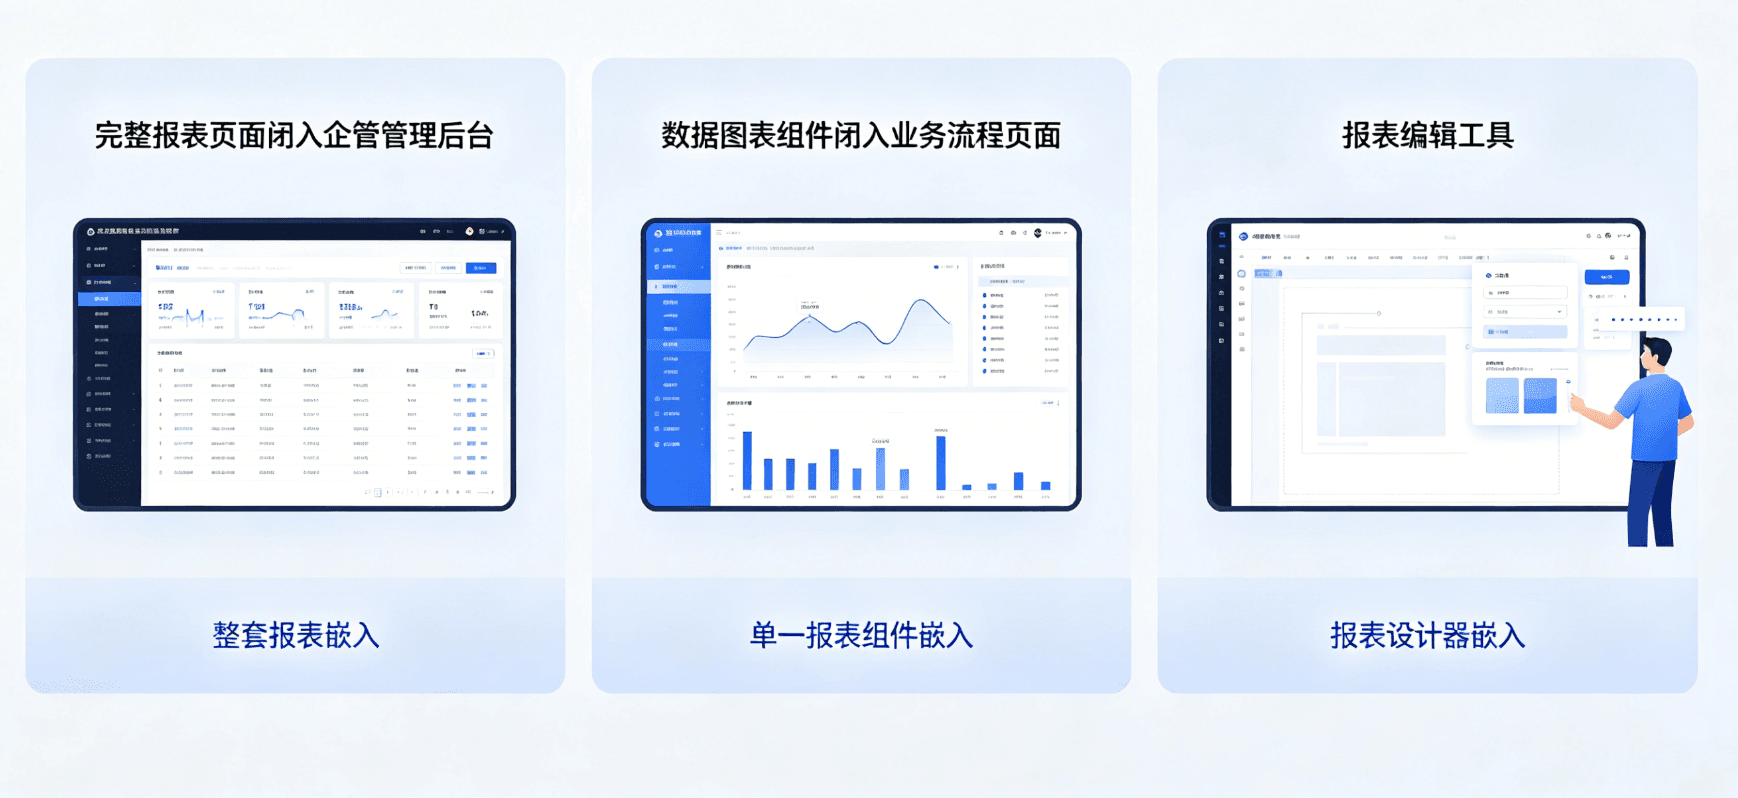
III.I Three Embedding Granularities
| Granularity | Description | Applicable Scenarios |
|---|---|---|
| Full report embedding | Embed a complete report page into a third-party application | Enterprise portals, management backends |
| Single report component embedding | Embed only a specific report’s display area | Embed data dashboards within business pages |
| Report designer embedding | Embed report editing capabilities into a third-party application | Enable end users to self-create and modify reports |
III.II Embedding Technical Points
- iFrame / Web Component: Standard frontend embedding approach, compatible with any framework
- SSO integration: Embedded reports automatically inherit the host application’s login state—no second authentication needed
- Data permission isolation: Embedded reports automatically apply the host application’s data permission rules
- Style customization: Report colors, fonts, and spacing can be customized to match the host application’s branding
- Event communication: Bidirectional event communication between reports and host applications—operations in reports can trigger business logic in the host application
III.III Multi-Tenant Architecture
For SaaS scenarios, HENGSHI’s reporting module natively supports multi-tenancy—
- Tenant-level data isolation: Each tenant can only see their own data
- Tenant-level report templates: SaaS vendors can create generic templates, each tenant customizes based on the template
- Tenant-level permissions: Each tenant’s administrator can manage report permissions within their tenant
- Tenant-level resource quotas: Limit each tenant’s number of reports, data volume, etc.
IV. Reports vs. Dashboards: When to Use Which?
Many enterprises confuse reports and dashboards in BI construction, leading to suboptimal tool selection and user experience. Here’s the difference in positioning:
| Dimension | Report | Dashboard |
|---|---|---|
| Purpose | Record, verify, archive | Monitor, explore, decide |
| Format | Tabular, precise layout | Chart-first, visualization priority |
| Interaction | Download, print, sign | Drill-through, filter, link |
| Users | Operations, finance, compliance | Management, analysts |
| Frequency | Daily/weekly/monthly reports | Real-time/near-real-time monitoring |
| Typical scenarios | Financial reports, sales dailies, inventory lists | Operations cockpit, real-time dashboards |
HENGSHI’s platform covers both reports and dashboards, allowing users to choose the right tool for the scenario rather than being forced to choose one or the other.
V. Integration with Technology Stack
V.I Data Source Adapters
HENGHSHI reporting supports connecting to multiple data sources:
- Relational databases: MySQL, PostgreSQL, Oracle, SQL Server
- MPP databases: ClickHouse, StarRocks, Doris
- Data lakes: Apache Iceberg, Apache Hudi
- Cloud data services: MaxCompute, Redshift, BigQuery
- API data sources: RESTful API, GraphQL
V.II Frontend Technology Stack Compatibility
HENGHSHI reporting’s embedding approach has no restrictions on the host application’s frontend technology stack:
- React / Vue / Angular: Embed via Web Component
- Traditional jQuery / backend templates: Embed via iFrame
- Mobile H5 / mini programs: Fetch data via API + custom rendering
V.III Integration with Metrics Platform
Data in reports can directly reference metrics from the metrics platform rather than hard-coded queries. This means—
- When metric definitions update, all reports using those metrics auto-reflect the changes
- Different reports can use the same metric set, ensuring cross-report data consistency
- Reports can directly inherit metric permission controls
VI. Frequently Asked Questions
Q1: What’s the difference between HENGSHI reporting and FineReport/FanRuan?
A: The core difference lies in positioning. FineReport is a standalone reporting tool; HENGSHI reporting is a module within the HENGSHI BI PaaS platform. If you only need reporting, FineReport may be more focused; if you need an integrated solution of “reporting + dashboards + ChatBI + metrics management” with the ability to embed these capabilities into your product, HENGSHI’s solution is more suitable.
Q2: How is the reporting module’s performance? Will large data volumes cause lag?
A: HENGSHI reporting uses server-side pagination and data push-down mechanisms—the frontend only renders visible rows on the current page. For million-row-level reports, loading can complete in seconds. Actual performance depends on data source query performance and network environment.
Q3: Does reporting support mobile viewing?
A: Yes. Reports auto-adapt to screen width on mobile, supporting landscape viewing for wide tables. However, complex reports (e.g., those exceeding 20 columns) have limited mobile viewing experience—dashboards are recommended for mobile priority.
Q4: Can charts be embedded in reports?
A: Yes. HENGSHI reporting supports embedding mini-charts (sparklines, data bars) within table cells, and also supports mixing tables and visualization charts on report pages.
VII. Summary
In the grand narrative of AI BI, enterprise reporting seems like an insufficiently “sexy” topic. But it’s these “not sexy enough” foundational capabilities that determine the data consumption experience in daily enterprise operations.
The core value of HENGSHI enterprise reporting lies in “embedding”—it’s not about getting enterprises to buy another reporting tool, but about embedding reporting capabilities into existing products and processes. For ISVs and SaaS vendors, this means providing enterprise-grade reporting experiences to customers without developing a reporting module themselves; for enterprise IT, this means unifying group-wide reporting standards and eliminating siloed reporting practices across departments.
This article is based on HENGSHI Technologies’ BI PaaS platform enterprise reporting module information. Specific features and performance are subject to the latest official version.