
Article body
Full article
一、Why Nobody Uses Your ChatBI
Many enterprises experience an awkward phenomenon after launching ChatBI: the IT department thinks the functionality is powerful, but business users think “it’s just okay.” The root cause is usually not technical—it’s that usage habits haven’t caught up.
Typical Profile 1: Doesn’t know what to ask. Opens the ChatBI dialog box, faces a blank input field, and doesn’t know what to ask. This “blank canvas anxiety” is the biggest psychological barrier to user exploration.
Typical Profile 2: Asked once and left when unsatisfied. The first question didn’t get the desired answer, so they directly close the page and never come back. Users often expect AI to hit the mark on the first try—but ChatBI’s core value is precisely demonstrated through multi-turn follow-up questions. Nobody teaches users this.
Typical Profile 3: Answers don’t match their own understanding, and they don’t know how to verify. The AI returns data that doesn’t match their impression, and they don’t know who to believe. They choose to trust themselves, and ChatBI gets shelved.
Below, we address each of these three typical problems with solutions.
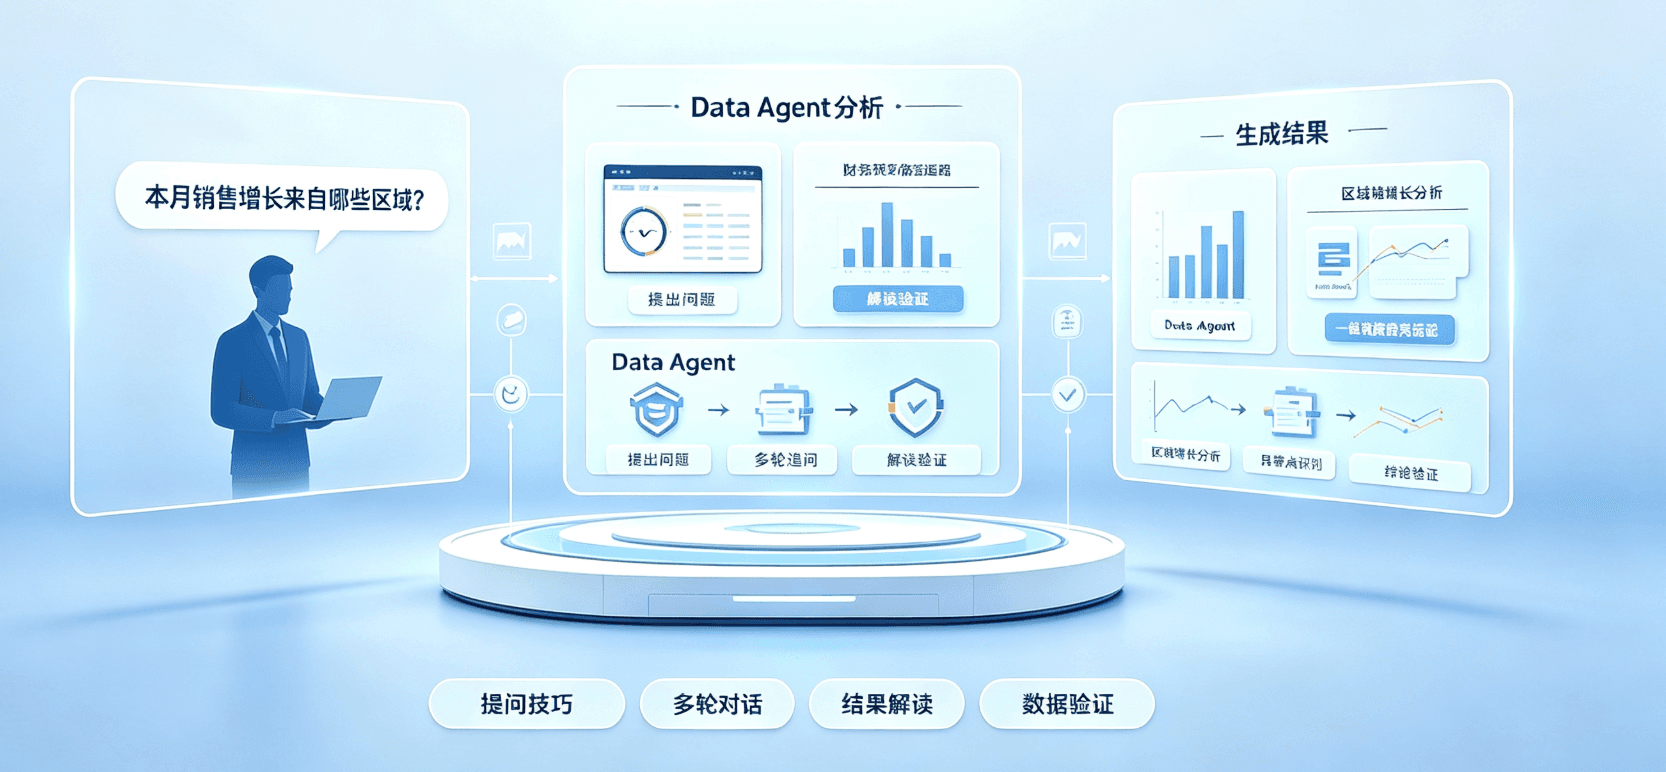
二、Beginner Level: From “Don’t Know What to Ask” to “Knowing How to Ask”
2.1 Use “Question Templates” to Lower the Barrier to Entry
For users just starting with ChatBI, the most practical approach is to provide a set of question templates. Templates aren’t restrictions—they’re guidance.
Time-based questions: “What was the sales amount yesterday / last week / last month / this quarter so far?” “How did it compare to the same period last year?” Ranking questions: “Top 10 stores / products / regions by sales this month?” “Rankings of product categories by fastest YoY growth?” Comparison questions: “East China vs. North China region average order value comparison?” “Online vs. offline channel gross margin difference?” Trend questions: “User repurchase rate trend over the past 6 months?” “Daily active user trend this quarter?”
These templates cover over 80% of daily analysis scenarios. Recommended: directly display these templates on the company internal Wiki or ChatBI interface, so users can click to auto-fill questions and eliminate the psychological barrier of the blank page.
2.2 Clarify the Three Elements: “Time,” “Scope,” and “Metric”
An effective ChatBI question typically contains three elements: Time—which time period of data you want to look at (yesterday/last week/last three months); Scope—which business scope of data you want to see (which region/which category/which channel); Metric—which metric you want to look at (sales amount/gross margin/repurchase rate).
Compare vague vs. precise questions. If you ask “How are sales?” ChatBI doesn’t know what time dimension, scope, or metric you’re looking at—it can only guess, and the probability of guessing wrong is high. If you ask “What was the sales amount for the East China region’s online channel yesterday?” all three elements are complete, ChatBI has almost no ambiguity, and result accuracy increases significantly.
2.3 Use Synonyms and Colloquial Expressions
A good ChatBI should understand business users’ natural language, but as a user, knowing which expressions the system recognizes also improves success rates.
Hengshi ChatBI recognizes common synonym mappings: “how much was sold,” “transaction amount,” “revenue,” and “sales amount” all map to the sales_amount metric. “User,” “customer,” and “member” all map to the user dimension table. “Last month,” “the previous month,” “past 30 days,” and “recent month” all map to the corresponding date range.
If you find a commonly used expression isn’t recognized during early use, record the case and feedback to the administrator to add to the semantic mapping—the more mappings accumulate, the better ChatBI becomes.
三、Advanced Level: Multi-Turn Dialogue Is the Correct Way to Use ChatBI
3.1 A Single Answer Is Just the Starting Point—Follow-Up Questions Are Key
Many users treat ChatBI like a search box—ask one question and wait for one answer. This usage only unlocks less than 30% of ChatBI’s capabilities.
Real data analysis is exploratory and iterative. You ask “yesterday’s sales,” find that East China region dropped 15%, naturally follow up with “which categories dropped in East China?” Seeing that the apparel category dropped 30%, you follow up again with “in which stores did apparel drop the most?” After locating the specific store, you further ask “what were the foot traffic and conversion data for this store over the past week?” That’s four rounds of dialogue, each round getting closer to the truth.
3.2 Follow-Up Techniques: Drill-Down, Comparison, Attribution
Drill-down means breaking down along data dimensions. Start from region, drill down to province, then to city, then to store. In Hengshi ChatBI, expressions like “break down by category” or “drill down by store” trigger this.
Comparison means finding a reference group for comparative analysis. See how the declining categories differ from rising categories in terms of price band, promotional intensity, and target customer group. You can use expressions like “compare East China and North China regions” or “compared to the same period last year.”
Attribution means finding the cause of changes. During a marketing campaign, a city’s sales increased significantly—ask “what are the reasons for the increase,” and ChatBI will provide multi-dimensional explanations combining campaign calendars, category structure, and average order value changes.
These three types of follow-ups aren’t used in isolation—they’re often交叉 used in practice. First drill down to find key dimensions, then analyze causes through attribution, and finally use comparison to verify the accuracy of conclusions.
四、Validation Level: How to Judge Whether ChatBI Is Correct
4.1 Three Quick Validation Questions
After receiving ChatBI’s answer, use three quick validation questions to judge reliability. First: Is the data magnitude correct?—if monthly sales typically hover around 5 million, and AI returns 500,000 or 50 million, there’s probably a problem. Second: Is the trend direction reasonable?—if a category’s MoM growth was around 5% last quarter and AI shows 80% MoM growth this time, there may be a definition anomaly or filter condition error. Third: Is the definition consistent?—does ChatBI’s answer match the number you see on the known dashboard? If not, further investigation is needed.
4.2 Check Data Sources
Every Hengshi ChatBI answer can be expanded to view “Data Source”—which metric, which dataset, and what filter conditions the result is based on. As long as information is transparent, users can independently judge reliability. Develop the habit of “check source before checking conclusion.”
4.3 When in Doubt, Ask “How Did You Calculate This”
If ChatBI gives you an answer you think is off, you don’t need to guess whether it’s wrong. Just ask “how was this calculated” or “which metric’s data was used,” and ChatBI will tell you which metric definition, which dataset, and which filter conditions it used. That way, even if the result is indeed wrong, you know which link had the problem and can precisely feedback to the data team.
五、Team Adoption Level: How to Get More People Using It
5.1 Find a “High-Frequency Scenario” as a Breakthrough Point
Don’t try to get all departments across the company using ChatBI simultaneously. Find the scenario with the highest usage frequency and most obvious value as a breakthrough point.
Sales team has a daily morning meeting needing to see yesterday’s performance data—set “yesterday’s East China region sales compared to last month’s daily average” as a template for them so they can see it with one click. Operations team has weekly review meetings needing campaign effect data—help them create quick templates for common campaign analysis questions. Finance team needs to produce monthly business analysis reports at month-end—help them organize the corresponding ChatBI Q&A chain for the report framework.
After running through one scenario successfully, expansion to more scenarios naturally follows.
5.2 Establish a “Question Feedback” Mechanism
Place a “Was this answer helpful?” feedback button next to the ChatBI interface. Why is this button so important? First: questions that receive downvotes are automatically collected, and the data team regularly analyzes these failure cases to optimize semantic mappings and metric definitions. Second: “don’t know how to ask” can also be feedback—the data team creates quick questions based on high-frequency search terms.
5.3 Regularly Share “ChatBI Pro Cases”
Every two weeks or monthly, share one or two “ChatBI done well” cases in the internal group—for example, an Operations colleague used ChatBI to discover an abnormal return rate for a certain SKU and drove supply chain improvement. Real cases are more convincing than any training or documentation.
六、Common Questions
Q1: Why can the same question sometimes be answered and sometimes not?
Possible variation in expression. Recommended: record the specific phrasing that “couldn’t be answered” and feedback to the data team—the semantic mapping may need this expression added.
Q2: Can ChatBI directly give analysis recommendations?
Yes. You don’t have to ask a specific data query. You can also ask “Help me look at what notable trends are worth关注的 in East China recently,” and ChatBI will provide summarized analysis recommendations based on changes across multiple metrics and dimensions.
Q3: What is the relationship between ChatBI and dashboards, and when should I use which?
Dashboards are suitable for viewing fixed core metrics—daily fixed KPI monitoring. ChatBI is suitable for temporary, exploratory analysis—looking at the reasons behind a sudden phenomenon, or doing an analysis dimension not preset on the dashboard. The two complement each other, not a replacement relationship.
Conclusion
ChatBI’s value isn’t having AI do all the analysis for you—it’s shortening the path from question to answer to seconds—but only if you know how to ask, how to follow up, and how to validate. Introduce this article’s question templates and validation methods to your team, and start running from one small scenario. ChatBI usage rates will grow naturally.
This article is based on Hengshi ChatBI product usage practices.