
Article body
Full article
1. Understanding Each Product’s Role
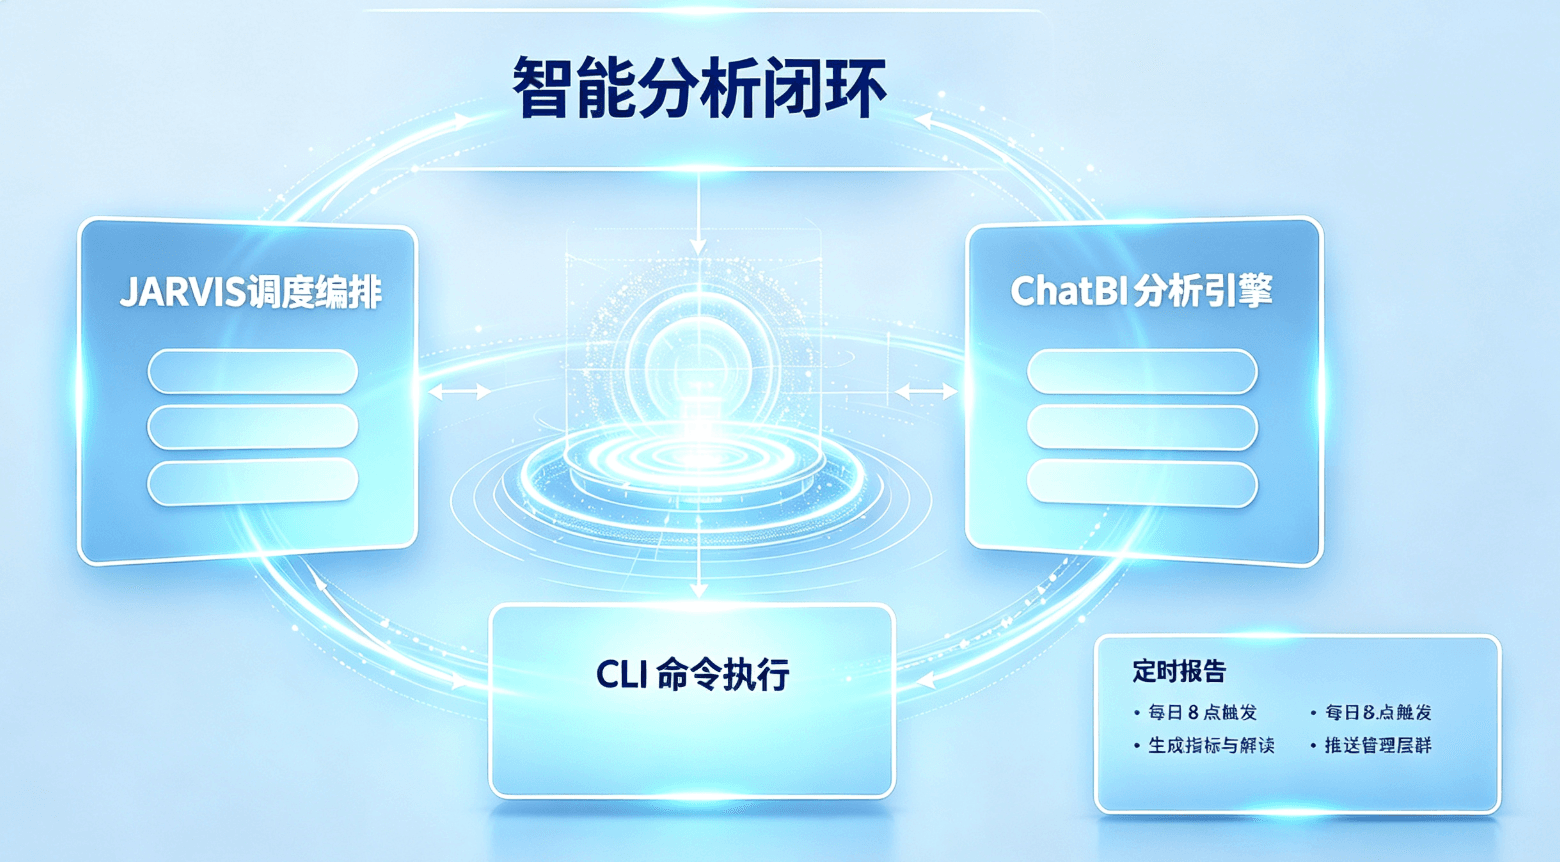
ChatBI’s core capability is “understanding questions” and “generating analysis.” What it can’t do—it doesn’t know when to run an analysis, or how to push results to the right place. ChatBI is fundamentally an analysis engine, not a scheduling or execution engine.
JARVIS’s core capability is “scheduling” and “orchestration.” What it can’t do—it only manages scheduling workflows but doesn’t perform specific BI operations, and it has no idea what analytical questions to ask (that’s business logic). JARVIS is a smart scheduler, but it needs analytical content to schedule.
CLI’s core capability is “execution.” What it can’t do—CLI has no business judgment; it needs to be told what commands to run. CLI is the hands, the executor of commands.
When the three work together, JARVIS acts as the brain to coordinate ChatBI and CLI to complete specified analysis actions at specific times or when specific events occur, pushing results to the right people. This integration is the complete closed loop of Hengshi’s intelligent analytics.
2. Pattern 1: Scheduled Reports — JARVIS Scheduling + ChatBI Generation + Message Push
2.1 Scenario
Every morning at 8 AM, the system automatically: queries yesterday’s core operational metrics via ChatBI, generates a text summary via ChatBI, assembles data and summary into a formatted report, and pushes it to the management group via Enterprise WeChat.
2.2 Implementation Path
Create a scheduled task in JARVIS set to trigger every morning at 8 AM. The first step calls ChatBI to query multiple preset questions. The second step fills ChatBI’s returned data into a preset report template. The third step pushes the formatted report to the specified chat group.
Key configuration point: JARVIS has fault tolerance configured—if ChatBI’s first query times out due to network issues, it automatically retries after 3 minutes. If all three retry attempts fail, it sends a system alert to the data team.
2.3 Templated vs. Free-Form Generation
For fixed-format daily reports, preset report templates work best—data fills into the template framework with consistent formatting and high readability. For occasional in-depth analysis reports, use ChatBI’s natural language generation capability to write a free-format analytical summary. Both can be used in the same report: metric cards use template format, while analytical commentary uses free generation.
3. Pattern 2: Event-Driven Root Cause Analysis — ChatBI Detects Anomaly + JARVIS Initiates Deep Analysis + CLI Executes Operations
3.1 Scenario
Each morning, during routine data checks, ChatBI discovers that East China region sales have declined 23% year-over-year. This anomaly automatically triggers a root cause analysis process: ChatBI drills into East China data across multiple dimensions to locate the specific categories and stores with anomalies, then CLI exports recent detailed data for that store to generate an analysis file, and finally the analysis results and attachments are pushed to the responsible person.
3.2 Implementation Path
Configure an event-trigger rule in JARVIS—triggered when a metric returned by ChatBI deviates from its normal fluctuation range by more than a threshold. Upon trigger, execute multi-round analysis: ChatBI drills down by category, store, and SKU layer by layer, CLI exports abnormal data details, and finally pushes the analysis report and data to the responsible party, supporting manual initiation of supplementary analysis.
Key configuration point: Anomaly thresholds are not hardcoded but based on dynamic baselines of the metric’s historical data—natural weekend fluctuations won’t be falsely reported as anomalies.
3.3 Extended Deep Analysis
An entry can also be attached at the end of the analysis report allowing managers to manually trigger a supplementary ChatBI analysis of the anomaly with one click. After clicking, managers can enter Hengshi’s ChatBI conversation interface to continue the existing multi-turn analysis context and perform further cross-diagnostic analysis based on the latest data.
4. Pattern 3: Monthly Data Settlement — CLI Batch Operations + ChatBI Result Verification + JARVIS Scheduling
4.1 Scenario
On the 1st of each month, after the financial system completes monthly settlement, it automatically triggers the BI system’s monthly data refresh process. CLI batch refreshes monthly report dashboard datasets, ChatBI performs sampling verification of key metrics against the financial system’s differences, and upon passing verification, JARVIS pushes a completion notification to the BI operations group.
4.2 Implementation Path
After the financial system completes settlement, it sends a signal to Hengshi. Upon receiving the signal, JARVIS calls CLI to batch refresh all monthly report dashboards, calling Hengshi’s API to verify the loading status of core dashboards after each batch completes.
After all dashboards finish refreshing, ChatBI automatically performs a sampling comparison: comparing Hengshi’s three core metrics (monthly sales, gross profit, net profit) against the values in the financial system’s settlement report. If the difference is within the acceptable error range, the task passes and a success notification is sent; if the difference exceeds the threshold, an alert is pushed and subsequent automated distribution is paused pending manual confirmation.
5. Pattern 4: Knowledge沉淀 — ChatBI Analysis Results + CLI Archiving + JARVIS Indexing
5.1 Scenario
Every valuable analysis result generated by ChatBI should not disappear into conversation history. Through JARVIS periodically triggering an archiving process, analysis Q&A records, analysis processes, and data snapshots are stored in a structured manner with automatically built searchable indexes.
5.2 Implementation Path
Triggered every Friday afternoon via a JARVIS scheduled task, filtering all ChatBI conversations from that week with deep analysis value, CLI archives them to the specified directory, and JARVIS automatically updates the knowledge base index so historical analyses can be retrieved via natural language search.
This way, when the business side asks about “that analysis we did last time,” the knowledge base has complete context to quickly retrieve—no need to reanalyze from scratch.
6. Integration Design Principles
Loose coupling, strong conventions. ChatBI, CLI, and JARVIS each run independently without depending on each other’s runtime status. They communicate through agreed-upon data formats—task IDs, analysis results, output links, and so on.
Each step independently verifiable. Key nodes in the joint workflow should have verification steps—sampling verification after data refresh, manual review after report generation—minimizing situations where the entire chain fails at once with no way to locate the problematic step.
Anomalies are visible by default. If any step has a problem, it should be pushed to a person rather than fail silently. This is fundamental but easiest to overlook in production.
Replayability. For joint pipelines that produce significant problem analyses, it is recommended to save full-chain input/output snapshots for review—every ChatBI reasoning step can be traced back.
7. FAQ
Q1: What is the response latency of the three-product integration?
Scheduled report generation flows typically complete within 1-3 minutes (mainly data query time). Multi-layer drill-down for root cause analysis may add several more rounds of reasoning, with total time generally 3-5 minutes. Deep export tasks with large data volumes follow an async pattern and notify upon completion.
Q2: What if JARVIS scheduling ChatBI and ChatBI goes down?
JARVIS has default timeout and retry mechanisms. If the first call fails, it automatically retries within the specified time; if it exceeds the set number of retry attempts, it triggers an alert to notify operations.
Q3: Can the output format of ChatBI analysis results be customized?
Yes. Report templates can be customized—when JARVIS calls ChatBI, it specifies the desired output format, and ChatBI formats the output accordingly.
Conclusion
The relationship between ChatBI, CLI, and JARVIS can be analogized as: ChatBI is the analyst, responsible for thinking and answering questions; CLI is the operator, responsible for executing specific system operations; JARVIS is the scheduling manager, responsible for handing the right tasks to the right people at the right time. Using any one alone only solves part of the problem; only when all three work together can BI truly transform from a tool that needs people to push it forward into an intelligent system that can analyze, execute, and report on its own.
This article is based on Hengshi ChatBI, CLI, and JARVIS product integration capabilities.